Search This Blog

Tuesday, June 28, 2022

The Crowd: A Study of the Popular Mind – Gustave Le Bon

The Crowd: A Study of the Popular Mind – Gustave Le Bon

Get a FREE membership video! Subscribe to our Newsletter.

The following is a transcript of this video.

The nature of crowds has long been a topic of interest in philosophy. However, the 18th and 19th centuries were a time when an increased emphasis was placed on understanding the psychology of crowds. For example,  the 18th century philosopher Jean Jacques Rousseau proclaimed that  “…we have a very imperfect knowledge of the human heart if we do not also examine it in crowds.”

Gustave Le Bon (1841-1931), a French social psychologist, is often seen as the father of the study of crowd psychology. Le Bon believed an understanding of crowd psychology was essential for a proper understating of the both history and the nature of man. As he wrote in his classic and highly influential work The Crowd: A Study of the Popular Mind: 

“It is crowds rather than isolated individuals that may be induced to run the risk of death to secure the triumph of a creed or an idea, that may be fired with enthusiasm for glory and honour… Such heroism is without doubt somewhat unconscious, but it is of such heroism that history is made.”(The Crowd: A Study of the Popular Mind – Gustave Le Bon)

In this video we will provide a summary of Le Bon’s classic work. In particular, we will investigate his insights into the nature of crowds, look at the role ideas play in influencing crowds, examine the  religious sentiment of crowds, and discuss  the psychological and emotional benefits one derives from joining a crowd.

What is a crowd? Le Bon defined a crowd as a  group of individuals united by a common idea, belief, or ideology.

The idea which unites a crowd is not chosen by a process of clear reasoning and examination of evidence. Instead, as we will discuss in more detail later, crowds accept beliefs and ideas superficially and utilize them as fuel for revolutionary action.

When an individual becomes part of a crowd, according to Le Bon, he undergoes a profound psychological transformation. That is, he  ceases to operate as an individual: 

“He is no longer himself, but has become an automaton who has ceased to be guided by his will.” (The Crowd: A Study of the Popular Mind – Gustave Le Bon)

With such a psychological transformation, an individual no longer lives for himself, but instead becomes a pawn who sacrifices his own personal ends and goals in favour of those of the crowd:

“In a crowd every sentiment and act is contagious, and contagious to such a degree that an individual readily sacrifices his personal interest to the collective interest.” (The Crowd: A Study of the Popular Mind – Gustave Le Bon)

As was mentioned earlier, Le Bon maintained that a crowd forms when an  influential idea unites a number of individuals and propels them to act towards a common goal. These influential ideas, however, are never created by members of the crowd. Instead,  they are brought into the world by the minds of great individuals.

Since those who compose a crowd are by their very nature mediocre, they are incapable of understanding these ideas in their  original form. Therefore, in order for an idea to unite and influence a crowd,  it must first be thoroughly simplified:

“Ideas being only accessible to crowds after having assumed a very simple shape must often undergo the most thoroughgoing transformations to become popular. It is especially when we are dealing with somewhat lofty philosophical or scientific ideas that we see how far-reaching are the modifications they require in order to lower them to the level of the intelligence of crowds…. However great or true an idea may have been to begin with, it is deprived of almost all that which constituted its elevation and its greatness by the mere fact that it has come within the intellectual range of crowds and exerts an influence upon them.” (The Crowd: A Study of the Popular Mind – Gustave Le Bon)

For example, a great philosopher could extol  the nature of liberty in an 800 page masterpiece. However, the crowd, incapable of comprehending such thoughts, would require the  concept of liberty to be thoroughly simplified in order for it to stimulate revolutionary action. Le Bon proposed that  this is where leaders come in. For it is the leader of a crowd who communicates simplified ideas to the crowd and in doing so unites it together and stimulates it to act. 

“The majority of men, especially among the masses, do not possess clear and reasoned ideas on any subject whatever outside their own specialty. The leader serves them as guide.” (The Crowd: A Study of the Popular Mind – Gustave Le Bon)

In the modern day one can see how invigorated and rejuvenated crowds become when they hear a leader pronounce that a cause is being  fought in the name of freedom, peace, or prosperity. Once these words are proclaimed the members of the crowd nod their heads in blind obedience to whatever else follows from the leader’s mouth – completely ignorant as to the corrupt purposes that may be the true guide for the leader’s  actions.

“How numerous are the crowds that have heroically faced death for beliefs, ideas, and phrases that they scarcely understood!”(The Crowd: A Study of the Popular Mind – Gustave Le Bon)

Referring to the ideas which leaders manipulate in order to govern and control crowds, Le Bon wrote:

“By many they are considered as natural forces, as supernatural powers. They evoke grandiose and vague images in men’s minds, but this very vagueness that wraps them in obscurity augments their mysterious power. They are the mysterious divinities hidden behind the tabernacle, which the devout only approach in fear and trembling.”(The Crowd: A Study of the Popular Mind – Gustave Le Bon)

Approaching these simplified, and therefore gravely misunderstood, ideas as mysterious divinities, a crowd always forms a  religious relationship to the ideas which motivate them to action. This being the case even when the ideas have no explicitly religious component:  “A person is not religious solely when he worships a divinity, but when he puts all the resources of his mind, the complete submission of his will, and the whole-souled ardour of fanaticism at the service of a cause or an individual who becomes the goal and guide of his thoughts and actions.”

Along this line of reasoning Le Bon continued:

“Were it possible to induce the masses to adopt atheism, disbelief would exhibit all the intolerant ardour of a religious sentiment, and in its exterior forms would soon become a cult.”(The Crowd: A Study of the Popular Mind – Gustave Le Bon)

While crowds are capable of acts which achieve both good and evil, Le Bon believed that more often than not  crowds commit barbarous and immoral actions.  Why do crowds so often act in an immoral manner?

Le Bon put forth the following explanation:  “…our savage, destructive instincts are the inheritance left dormant in all of us from the primitive ages. In the life of the isolated individual it would be dangerous for him to gratify these instincts, while his absorption in an irresponsible crowd, in which in consequence he is assured of impunity, gives him entire liberty to follow them.”

The 20th century  psychologist Carl Jung reiterated this idea:

“…if people crowd together and form a mob, then the dynamisms of the collective man are let loose – beasts or demons that lie dormant in every person until he is part of a mob. Man in the mass sinks unconsciously to an inferior moral and intellectual level, to that level which is always there, below the threshold of consciousness, ready to break forth as soon as it is activated by the formation of a mass.” (Carl Jung)

(Check out our 2-part video mini-series on Carl Jung)

Nonetheless, Le Bon believed he understood what motivated individuals to join a crowd.

When an individual lives his life as an individual – that is, when he forced to take responsibility for his life – he is apt to feel a crushing burden and sense of impotence he can’t seem to shake.

In joining a crowd or a mass movement, the individual is temporarily relieved of this responsibility and sense of impotence, and comes to feel that he is capable of shaking the foundations of the earth:

“In crowds the foolish, ignorant, and envious persons are freed from the sense of their insignificance and powerlessness, and are possessed instead by the notion of brutal and temporary but immense strength.”(The Crowd: A Study of the Popular Mind – Gustave Le Bon)

Le Bon thought that we are all in a sense a part of a crowd, as we are all  motivated by ideas and ideologies which are socialized into us and via communal action unite us with others in our culture. Many of our actions, in other words,  are motivated by ideas, beliefs, and ideologies which we do not understand. Le Bon thought it was impossible to fully extricate one’s self from all of these implicit ideas.  Yet he did maintain that partial freedom and independence can be attained by bringing to the light of reason the ideas, values, and beliefs which guide our actions. For as Le Bon  wisely claimed:

“The tyranny exercised unconsciously on men’s minds is the only real tyranny, because it cannot be fought against.”(The Crowd: A Study of the Popular Mind – Gustave Le Bon)

Be sure to supplement your knowledge of crowds with information about how those in power use fear as a means of social control.


Monday, June 20, 2022

McClellan Summation Index

McClellan Summation Index

Introduction

Developed by Sherman and Marian McClellan, the McClellan Summation Index is a breadth indicator derived from the McClellan Oscillator, which is a breadth indicator based on Net Advances (advancing issues less declining issues). The Summation Index is simply a running total of the McClellan Oscillator values. Even though it is called a Summation Index, the indicator is really an oscillator that fluctuates above and below the zero line. As such, signals can be derived from bullish/bearish divergences, directional movement and centerline crossovers. A moving average can also be applied to identify upturns and downturns.

Calculation

Previous day's Summation Index* + current day McClellan Oscillator

* The very first Summation Index is simply the value of the McClellan Oscillator.

StockCharts.com provides two options for the McClellan Summation Index: unadjusted and ratio-adjusted. Net Advances is the base indicator used to calculate the McClellan Oscillator (and, by extension, the Summation Index); it is derived from the number of advancing issues less the number of declining issues. This number is used to calculate the “traditional” Summation Index. Ratio-adjusted Net Advances equals Net Advances divided by advances plus declines. This shows Net Advances relative to the total, which makes it possible to compare values over a long period of time. This article focuses on the Ratio-adjusted Summation Index. See the McClellan Oscillator article for more details on ratio-adjusted Net Advances.

Interpretation

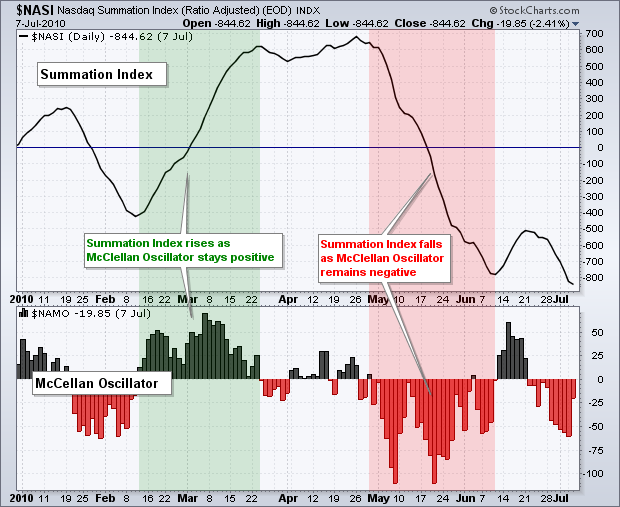
The Summation Index rises when the McClellan Oscillator is positive and falls when the McClellan Oscillator is negative. Extended positive numbers in the McClellan Oscillator cause the Summation Index to trend higher. Conversely, extended negative readings cause the Summation Index to trend lower.

Because of its cumulative nature, the Summation Index is a slower version of the McClellan Oscillator. The index crosses the zero line fewer times, forms divergences less often and produces fewer signals in general. Whereas the McClellan Oscillator can be used for short-term and medium-term timing, the Summation Index is generally used for medium-term and long-term timing.

There are three basic signals. First, the Summation Index generally favors the bulls when positive and the bears when negative. Second, chartists can look for bullish and bearish divergences to anticipate reversals. Third, chartists can identify directional movement to define a bullish or bearish bias.

Nasdaq Negative Bias

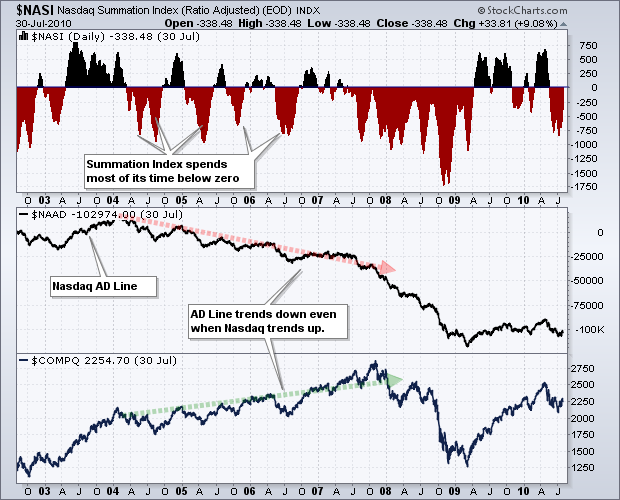
Before looking at specific signals, note that the Nasdaq Summation Index has a long-term downward bias. This is because the Nasdaq AD Line also has a long-term downward bias. This bias stems from listing requirements that are not as stringent as NYSE. The Nasdaq is full of upstarts in industries ranging from biotech to technology to alternative energy. There may be big upside potential, but there is also a risk of absolute failure and delisting. Stocks trend lower as failure becomes an option. Companies that fail are ultimately removed from the index, but their negative effect on these breadth indicators remains.

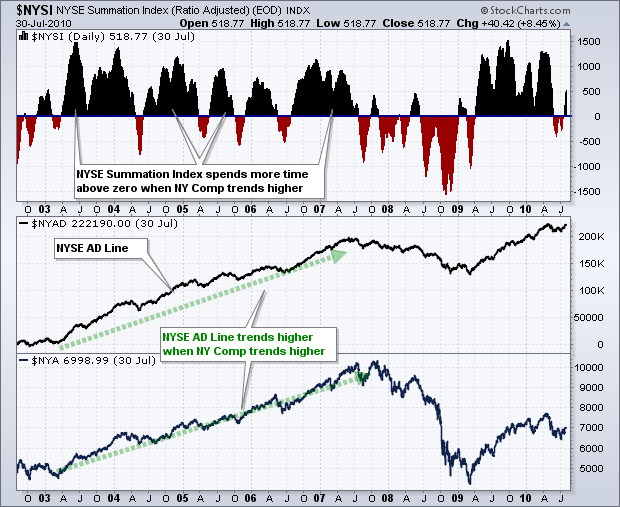
This negative bias does not affect short-term or medium-term movements, but it is clearly visible on long-term charts. The charts above show the Nasdaq Summation Index ($NASI) and the NYSE Summation Index ($NYSI) from August 2002 until August 2010 (eight years). Notice how the Nasdaq moved higher from 2003 until 2007. Despite a multi-year uptrend in the Nasdaq, the Nasdaq Summation Index spent more time in negative territory and the Nasdaq AD Line trended lower. The NY Composite also moved higher from 2003 until 2007. In contrast to the Nasdaq version, the NYSE Summation Index spent more time in positive territory and the NYSE AD Line trended higher the entire time (green trend line).

Positive vs. Negative

Like many momentum oscillators, the Summation Index provides a bullish or bearish bias when it is above or below its center line (zero). This is logical because the glass is half full when positive and half empty when negative. The Summation Index will be positive when the McClellan Oscillator has been largely positive for an extended period of time. It takes more than one positive/negative reading to push the Summation Index into positive/negative territory. In fact, it usually takes several positive readings to push the Summation Index into positive territory and keep it in positive territory. This is why the Summation Index is better suited for medium-term or long-term analysis.

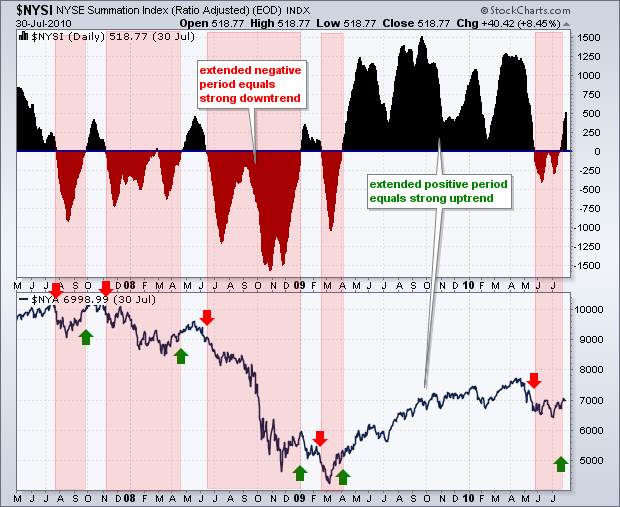
The chart below shows the NYSE Summation Index with the NY Composite. The red highlights show when the indicator moved into negative territory and remained negative. Sustained negative values from June to December 2008 coincided with an extended downtrend in the NY Composite. Conversely, extended positive values from April to May 2009 coincided with a sustained uptrend in the NY Composite. Like ALL indicators, the Summation Index is not perfect. There will be whipsaws or periods when zero line crossovers do not last long.

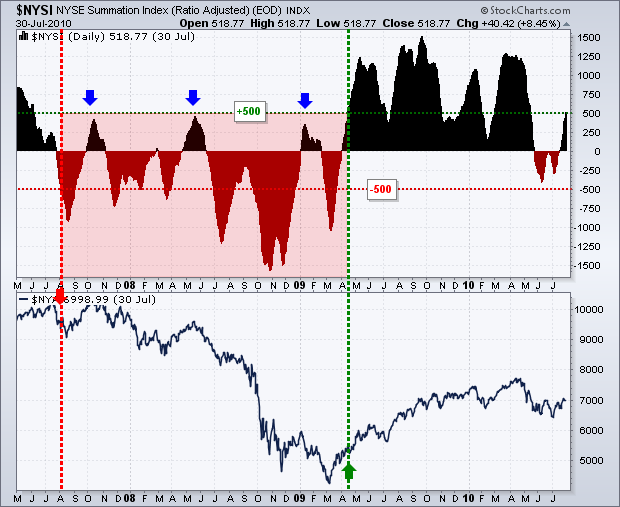
Chartists can also tweak the positive and negative values required for a bullish or bearish bias. The next chart shows the same time period for the NYSE Summation Index and NY Composite. Instead of the zero line, the bullish threshold is set at +500 and the bearish threshold is set at -500. A long-term bull signal is triggered when the Summation Index moves above +500 and remains valid until the index moves below -500. Similarly, a long-term bear signal is triggered when the Summation Index moves below -500 and remains valid until the index moves above +500. Instead of 10 signals in three years using the zero cross, there were only two signals using the +500/-500 cross. The Summation Index captured the long downtrend from August 2008 until April 2009 and the long uptrend from April 2009 until July 2010 (and counting). Notice how the area between 300 and 500 acted as resistance in 2007 and 2008 (blue arrows). Similarly, the -300 to -500 area acted as support in June 2010.

Directional Movement

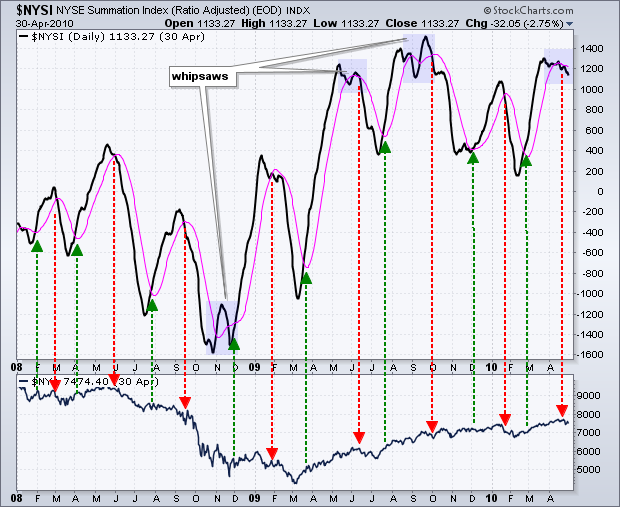
moving average can be applied to the Summation Index to identify upturns and downturns. The length of the moving average depends on your trading or investing style and timeframe. A short moving average (5-days) will generate quicker signals, but there will be more whipsaws. A longer moving average (20-days) will lag a bit and there will be fewer whipsaws. It is the eternal tradeoff in technical analysis. More speed means more whipsaws. Less speed reduces whipsaws at the expense of later entries.

The chart below shows the NYSE Summation Index with a 20-day SMA (pink). Even with this medium-term moving average, there are still plenty of signals and turns. Some signals were great, some were not and some produced whipsaws. The orange areas highlight whipsaws when there were three moving average crosses within a relatively short timeframe.

Divergences

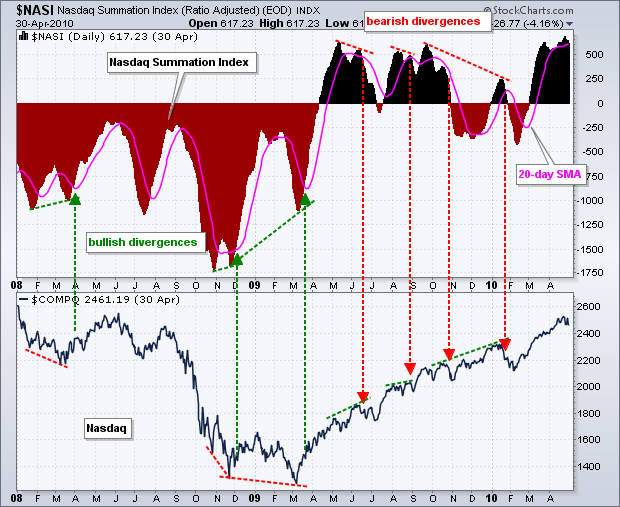
Bullish and bearish divergences in the Summation Index can help foreshadow reversals in the underlying index. However, not all divergences result in reversals or extended moves. The key, as always, is to separate robust divergences from weak divergences. A bullish divergence occurs when the Summation Index forms a higher low and the index forms a lower low. Even though the underlying index moved to new lows, the higher low in the Summation Index shows improving breadth. A bearish divergence forms when the Summation Index records a lower high and the index forges a higher high. Even though the underlying index moved to a new high, the Summation Index failed to exceed its prior high and showed deteriorating breadth.

Chartists should attempt to differentiate between small insignificant divergences and larger robust divergences. In addition, bearish divergences in a strong uptrend are more likely to fail - as are bullish divergences in a strong downtrend. Shallow divergences that form over a few weeks are more suspect than steep divergences that form over 1-4 months.

The chart below shows the Nasdaq Summation Index with the Nasdaq. There were three bullish divergences in the first half of the chart and four bearish divergences in the second half. A 20-day SMA was added to confirm a subsequent movement in the direction of the divergences. For example, the vertical green lines show the Summation Index moving above the 20-day SMA after a bullish divergence. Except for the last bullish divergence, the bearish divergences were steeper and covered longer timeframes. Also, notice that the bullish divergences occurred during a strong uptrend. These divergences did hint at short pullbacks within this uptrend, but they did not foreshadow an extended decline or a major reversal.

Conclusions

While the McClellan Oscillator puts a little momentum into the AD Line, the Summation Index takes a little out by slowing down the oscillator. The Summation Index is also quite a few steps removed from the original indicator, which is Net Advances. In other words, it takes three separate calculations to produce Summation Index values. The first derivatives (steps) are the 19-day EMA of Net Advances and 39-day EMA of Net Advances. The second derivative is the McClellan Oscillator, which is the 19-day EMA of Net Advances less the 39-day EMA of Net Advances. The third derivative is the Summation Index, which is a cumulative McClellan Oscillator. Each additional calculation changes Net Advances from its original form. This is not always bad, but chartists should keep this in mind when comparing the Summation Index with the corresponding index, the Nasdaq or the NY Composite. As with all indicators, Summation Index signals should be confirmed with other indicators or technical analysis techniques.

SharpCharts

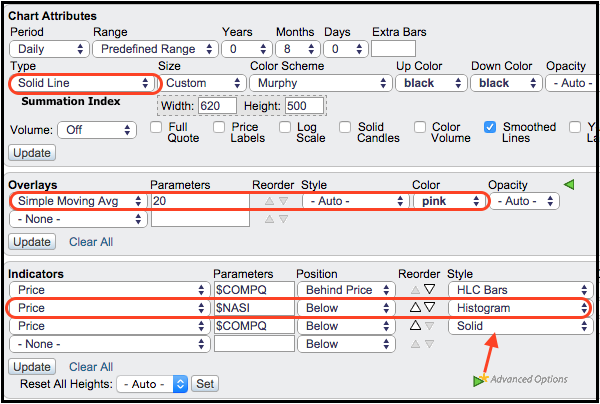
SharpCharts users can plot the Ratio-Adjusted Summation Index for the NYSE ($NYSI) or the Nasdaq ($NASI). The traditional (unadjusted) Summation Index symbols are $NYSIT and $NASIT, respectively. These indicators can be shown in the main chart window or in indicator windows above and below. The example below shows the Summation Index as a “line” plot in the main chart window with the underlying index behind it. This makes it easy to compare turns in the indicator with turns in the index. A 20-day SMA was added to the Summation Index to identify turns. Click here for a live example.

The Summation Index was also added as an indicator using the “Histogram” format. This makes it easy to identify crosses above and below the zero line. The underlying index (Nasdaq) is also shown in the lower window for comparison.

----------------------------------------------------
Source

https://school.stockcharts.com/doku.php?id=market_indicators:mcclellan_summation