Search This Blog

Monday, August 29, 2022

Another $4.5B exits Canadian mutual funds in July

Another $4.5B exits Canadian mutual funds in July

At times of extreme emotions, be contrary. If the mindless herd are pulling their money out of the market, then the market is the place to be. That makes me bullish...

-------------------------------------------------------------------------

Investors continued to pull their money out of Canadian mutual funds in July.

The latest data from the Investment Funds Institute of Canada (IFIC) showed there was a net redemption of $4.5 billion from equity and bond mutual funds in the month. That follows a net redemption of $10.4 billion in June.

Money market funds, which are generally considered relatively safer assets, saw a modest net inflow.

Earlier this week, Royal Bank of Canada shed some light on where some of that money could be shifting too: Guaranteed investment certificates (GICs).

RBC Chief Financial Officer Nadine Ahn said on a conference call with analysts on Wednesday the bank saw money pulled from its own mutual funds and that “RBC captured a good part of the shift as clients move to GICs during a period of elevated market uncertainty.”

The IFIC data showed mutual fund assets rose 4.3 per cent month-over-month in July to $1.86 trillion.

Meanwhile, exchange-traded funds (ETFs) experienced a net inflow of $1.5 billion last month. Investors gravitated to ETFs focused on fixed income, while equity ETFs saw a net outflow.

ETF assets rose by 5.1 per cent to $303.7 billion, according to the data.

The IFIC collects survey data accounts for about 91 per cent of the mutual fund industry and is complemented by information from Investor Economics.

Michelle Zadikian, BNN Bloomberg

-------------------------------------------------------

Source

https://www.bnnbloomberg.ca/another-4-5b-exits-canadian-mutual-funds-in-july-1.1810576


Sunday, August 28, 2022

Positive Q2 Earnings Turn Eyes Toward Jackson Hole

Positive Q2 Earnings Turn Eyes Toward Jackson Hole

In past reports, I discussed the personality of mid-term election years coupled with the consequences of the Fed raising interest rates. From January 4th to June 16th, the S&P 500 incurred a 26% decline. In my note last week, I discussed the duration of time that market corrections (bear markets) last relative to the market uptrends (bull markets). Evaluating this perspective of time and space often has a value from a non-emotional standpoint.

I want to make a special note before I continue, and that is that I like to take periods of time into consideration that include years prior to 1982. The period from 1982-2021 was a period of almost straight down interest rate declines from 21%-0%, whereas the present period is one of the interest rates rising. This is super important. Since bonds tend to be a trade-off to stocks in a "balanced" portfolio, segregating times when rates are rising is very important. The current correction has lasted 25% as many days as the uptrend from the March 2020 lows. Going back to 1942, the median period of time was 21%. So, from a space of time standpoint, this correction (currently at 25%) has very much dropped by a typical amount for a typical period of time. This has nothing to do with the geopolitical environment, supply chain issues, or the massive stimulus package that has been dropped on our economy, but every situation is different. This happens to be the set of bad cards dealt to us in our hands this time!

S&P 500 Daily Returns, Since 1929

The point that I am trying to make is that each Bear Market is relatively brief compared to the previous Bull Market. What needs to be remembered, also, is that even though the news tends to reflect the past, tends to continue beyond the point in time that the bottom of the market.  I believe that investors should expect the same in this correction.

Since company prices eventually are a reflection of earnings growth, consistency, and overall economic expansion, it should be noted that this second-quarter earnings season for the S&P 500 is about over, with 95% of the companies having reported results. On average, 75% of these companies have reported earnings up by 8% and revenues up by 14.1% vs. a year ago. That hardly sounds like a bad earnings season.

But even more important than this is what I call the "Magazine Cover Indicator." Quite often, when magazine covers from major financial publications (e.g. Forbes, Fortune, The Economist, etc.) are very negative or very positive, the negative or positive situation is already over. Well, below is the cover of Barron's from this last weekend:

 Barron's, frontpage, 8/22/22

I'm not saying that the whole world looks delicious right now, but I do think that the negativity of inflation and two-quarters of negative GDP growth could be pretty close to being over if not already bottoming. I am referring specifically to our domestic economy, as we have elevated inflation for the first time in almost four decades, weak global growth as China and Europe are struggling, central banks around the world that are mainly becoming more restrictive, as well as the Fed continuing its quantitative tightening, all of which combined are unprecedented.

There are many who quibble with the rally since June 16th, citing this as a "short covering" or a "garbage rally." But market internals is arguing the opposite. There are several ways to see this but take a look at the advance/ decline line below:

  • The advance/decline line hit an all-time high on August 17th.
  • This is a sign of a massive expansion in market breadth/participation.
  • Moreover, since 1950, every all-time high in the advance/decline line has been followed by a new all-time high in the S&P 500. 
  • This strengthens the case for Thomas Lee of Fundstrat's forecast for the S&P 500 to exceed 4,800 before year-end!

This all makes sense, but now that the markets have given back half of what they took away in the first six months of 2022, here is what worries me now/still: 

  • Nearly 100% of those economists questioned believe that the rate of acceleration in inflation has topped and that due to an economic slowdown and commodity pricing, used car pricing, and new home pricing dropping possibly the inflation scare has reached its high point. None of this seems to take into account the additional burst of stimulus that has been dumped on the market by Biden's ludicrous Inflation package and the semiconductor package.
  • The US economy will likely not reaccelerate without a supply-side change for energy and a fall in crude or the beginning of Fed easing. 
  • Earnings are not likely to accelerate going forward, but some disagreement on whether they should be flattish or should be lowered. Very few seem to have the view that there is a risk to forward profits like the COVID lockdown period or the Financial Crisis. This could be the roots of the "recessionary period." I actually believe that we very much will see recession- in some industries, and continued growth in others. 
  • Nobody seems to have a view that a Fed easing is imminent. Since inflation may have stopped its acceleration but maybe not completely reached its height, it may be some time before the Fed eases unless there is more substantial market weakness. 
  • Many investors still seem firmly entrenched in the bear camp and believe that the rally that has been seen since mid-June is nothing more than a fake-out and the market will continue lower once again. Maybe this is why there is still a record number of short positions on the S&P 500 index. 
  • Last, this week could continue to be difficult because nobody knows what Fed Chairman Powell is going to say at the Jackson Hole meeting this Friday. This is really the last time he is slated to make a big public announcement before the September 21 Fed meeting. 

The immediate future for the markets is clearly unknown but based on history and current earnings and future earnings forecasts give us decent confidence in the direction of certain sectors and companies. It is and has always been my opinion that building positions in companies and sectors that will benefit based on the current and future environment are the best policy for investing for growth.

As for income, selectivity is key as the interest rate markets still appear to be quite unfriendly. Time will tell, but patience is the word of the day in tumultuous times like we are currently in. 

Of course, please call with any questions you may have as we will adapt your portfolios to your individual situation, and address any concerns you may have. 

Ken South, August 24, 2022

-------------------------------------------------------

Source

https://www.tower68.com/blog/positive-q2-earnings-turn-eyes-toward-jackson-hole

Saturday, August 27, 2022

Lester Asset Management...MacroEconmic Outlook

Lester Asset Management...MacroEconmic Outlook

------------------------------------------------------------
Our view has been that inflationary pressures would show clear signs of easing before year-end as a result of monetary restraint imposed by both the Bank of Canada and the Federal Reserve. Fiscal deficits in Canada and the U.S. have been shrinking dramatically, and as a result the major causes of high current inflation, excessive monetary stimulus and massive fiscal deficits, have been removed. Published inflation numbers in both countries, because of time lags, are still extremely high, and policy will remain focused on getting price inflation on a sustainable trend back to a target level of 2%. Both central banks are focused on labor markets which are still very tight. Historically, inflation falls only when slack develops in the labor market. Unfortunately, unemployment and published inflation data are lagging indicators, which raises the risk of a weaker economy. But this is a necessary condition to get inflation down. There will, therefore, likely be a short-term decline in corporate profits and possible job losses. However, the impact on stock prices would likely be muted because the prospect of falling inflation is a bullish offset, and equities have already had a significant correction.

The important focus for investors should be on the future, not on today’s news. Markets are forward looking by roughly six months and in recent weeks there have been some positive developments. Market-based measures of inflation expectations for two to five years out have begun to fall sharply. The five-year indicator, for example, has recently dropped from about 2.6% to about 1.8%, which is below the Fed’s target. The two-year measure has dropped from 5% to about 3.3%. This is a significant development since it suggests that we are moving fairly quickly to the point where we can expect published inflation (and yields) to start falling back to more normal levels. Already, the 10-year Government bond yield in both countries appears to have made a cyclical top and is now on a downward slope. Developing economic weakness will, if extended, reinforce this downtrend which would also be good news for bond investors.

In summary, economic developments are pointing to the likelihood of a continued decline in longer-term interest rates as inflation expectations have dropped significantly. This bodes well for an end to monetary restraint and a peak in short-term interest rates before year-end which would tip the scales in favor of a “soft landing” and improving stock prices. Even though commodity prices, including energy, have fallen sharply from recent peaks, they are still far above the average of recent years. High commodity prices are a net positive for the Canadian economy. In addition, the Canadian dollar is cheap, which is playing a major role in the massive increase in Canada’s trade surplus with the US.

Stephen Takacsy, 
Olivier Tardif-Loiselle, 
Matthew Kaszel, 
Tony Boeckh,

July 15, 2022

-------------------------------------------------------------
Source

https://www.lesterasset.com/investment-reports/Quarterly-Comments-2022/2022-Second-Quarter-Letter

Friday, August 26, 2022

OpenText to buy software firm Micro Focus at 99% premium

OpenText to buy software firm Micro Focus at 99% premium

Canada’s Open Text Corp. struck a deal to buy UK software firm Micro Focus International Plc for about US$6 billion including debt, building on a strategy of growth by acquisition. 

The Waterloo, Ontario-based company is offering 532 pence per Micro Focus share, a 99 per cent premium to Thursday’s closing price. Open Text said it will fund the cash takeover bid with US$4.6 billion in new debt, US$600 million from an existing credit line and cash on its balance sheet. 

Newbury, UK-based Micro Focus sells enterprise software to thousands of organizations including Airbus SE, Hewlett Packard Enterprise Co. and Kellogg Co., according to its website. Its products help companies with cybersecurity, IT operations management, communications and messaging. Micro Focus says it does business with a majority of the Fortune Global 500. 

But the company has seen declines in its revenue and adjusted earnings before interest, taxes, depreciation and amortization every fiscal year since 2018. 

Under Chief Executive Officer Mark Barrenechea, Open Text has made a series of deals to bolster its software portfolio in recent years, including email encryption company Zix Corp. and cybersecurity firm Carbonite Inc. The Micro Focus acquisition is notable for its relative size: it’s worth nearly half of Open Text’s current enterprise value of US$12.8 billion, according to data compiled by Bloomberg. 

“Micro Focus brings meaningful revenue and operating scale to OpenText, with a combined total addressable market of US$170 billion,” Barrenechea said in a statement. “With this scale, we believe we have significant growth opportunities and ability to create upper quartile adjusted Ebitda and free cash flows.”

In an interview with Bloomberg last year, Barrenechea bemoaned the price of deals, saying the company’s desired targets were “too expensive, too overvalued.” The correction in technology stocks has brought valuations down quickly. Micro Focus shares have fallen 39 per cent in the past year.

Open Text is paying 2.2 times Micro Focus’s pro forma revenue for the past 12 months. The company said it sees the deal closing in the first quarter of 2023. 

Bloomberg first reported Open Text’s interest in Micro Focus in 2019. 

 ---------------------------------------------------

Source

https://www.bnnbloomberg.ca/opentext-to-buy-software-firm-micro-focus-at-99-premium-1.1810614

Tuesday, August 23, 2022

Why the 10-Year U.S. Treasury Yield Matters

Why the 10-Year U.S. Treasury Yield Matters

In a nutshell, slowly rising yields can be a positive sign, as investors' confidence grows and they switch from bonds to stocks and other investments. But yields rising sharply due to increasing inflation can be a sign of trouble on the horizon for the economy and the stock market, as it suggests an expectation that central banks will need to cool economic activity to prevent overheating.

 Interest rate hikes are often implemented to curb inflation, which makes capital more expensive, compressing the valuation of companies, while also hurting other markets such as real estate. Higher interest rates will hurt companies that typically hold more debt or have a high value placed on future cash flows.

----------------------------------------------------------------------------------------- 

These rates indicate the confidence of investors in the economy

Treasury bond yields (or rates) are tracked by investors for many reasons. The yields are paid by the U.S. government as interest for borrowing money via selling the bond. But what does this mean, and how do you find yield information?

Treasury Bills are loans to the federal government that mature at terms ranging from a few days to 52 weeks.1 A Treasury Note matures in two to 10 years, while a Treasury Bond matures in 20 or 30 years.23

The 10-year Treasury yield is closely watched as an indicator of broader investor confidence. Because Treasury bills, notes, and bonds carry the full backing of the U.S. government, they are viewed as one of the safest investments.4

Key Takeaways

  • Treasury securities are loans to the federal government. Maturities range from weeks to as many as 30 years.
  • Because they are backed by the U.S. government, Treasury securities are seen as a safer investment relative to stocks.
  • Bond prices and yields move in opposite directions—falling prices boost yields, while rising prices lower yields.
  • The 10-year yield is used as a proxy for mortgage rates. It's also seen as a sign of investor sentiment about the economy.
  • A rising yield indicates falling demand for Treasury bonds, which means investors prefer higher-risk, higher-reward investments. A falling yield suggests the opposite.

Bond Definition

Why Is the 10-Year Treasury Yield So Important?

The importance of the 10-year Treasury bond yield goes beyond just understanding the return on investment for the security. The 10-year is used as a proxy for many other important financial matters, such as mortgage rates. 

This bond also tends to signal investor confidence. The U.S Treasury sells bonds via auction and yields are set through a bidding process.5 When confidence is high, prices for the 10-year drop and yields rise. This is because investors feel they can find higher-returning investments elsewhere and do not feel they need to play it safe.

But when confidence is low, bond prices rise and yields fall, as there is more demand for this safe investment. This confidence factor is also felt outside of the U.S. The geopolitical situations of other countries can affect U.S. government bond prices, as the U.S. is seen as safe haven for capital. This can push up prices of U.S. government bonds as demand increases, thus lowering yields. 

4 Types of Treasury Debt

The U.S. Department of the Treasury issues four types of debt to finance government spending: Treasury bonds, Treasury bills, Treasury notes, and Treasury Inflation-Protected Securities (TIPS). Each varies by maturity and coupon payments.3126

Another factor related to the yield is the time to maturity. The longer the Treasury bond's time to maturity, the higher the rates (or yields) because investors demand to get paid more the longer their money is tied up. Typically, short-term debt pays lower yields than long-term debt, which is called a normal yield curve. But at times the yield curve can be inverted, with shorter maturities paying higher yields.

Economic Indicator

The 10-year Treasury is an economic indicator. Its yield provides information about investor confidence. While historical yield ranges do not appear wide, any basis point movement is a signal to the market.

Changing Yields Over Time

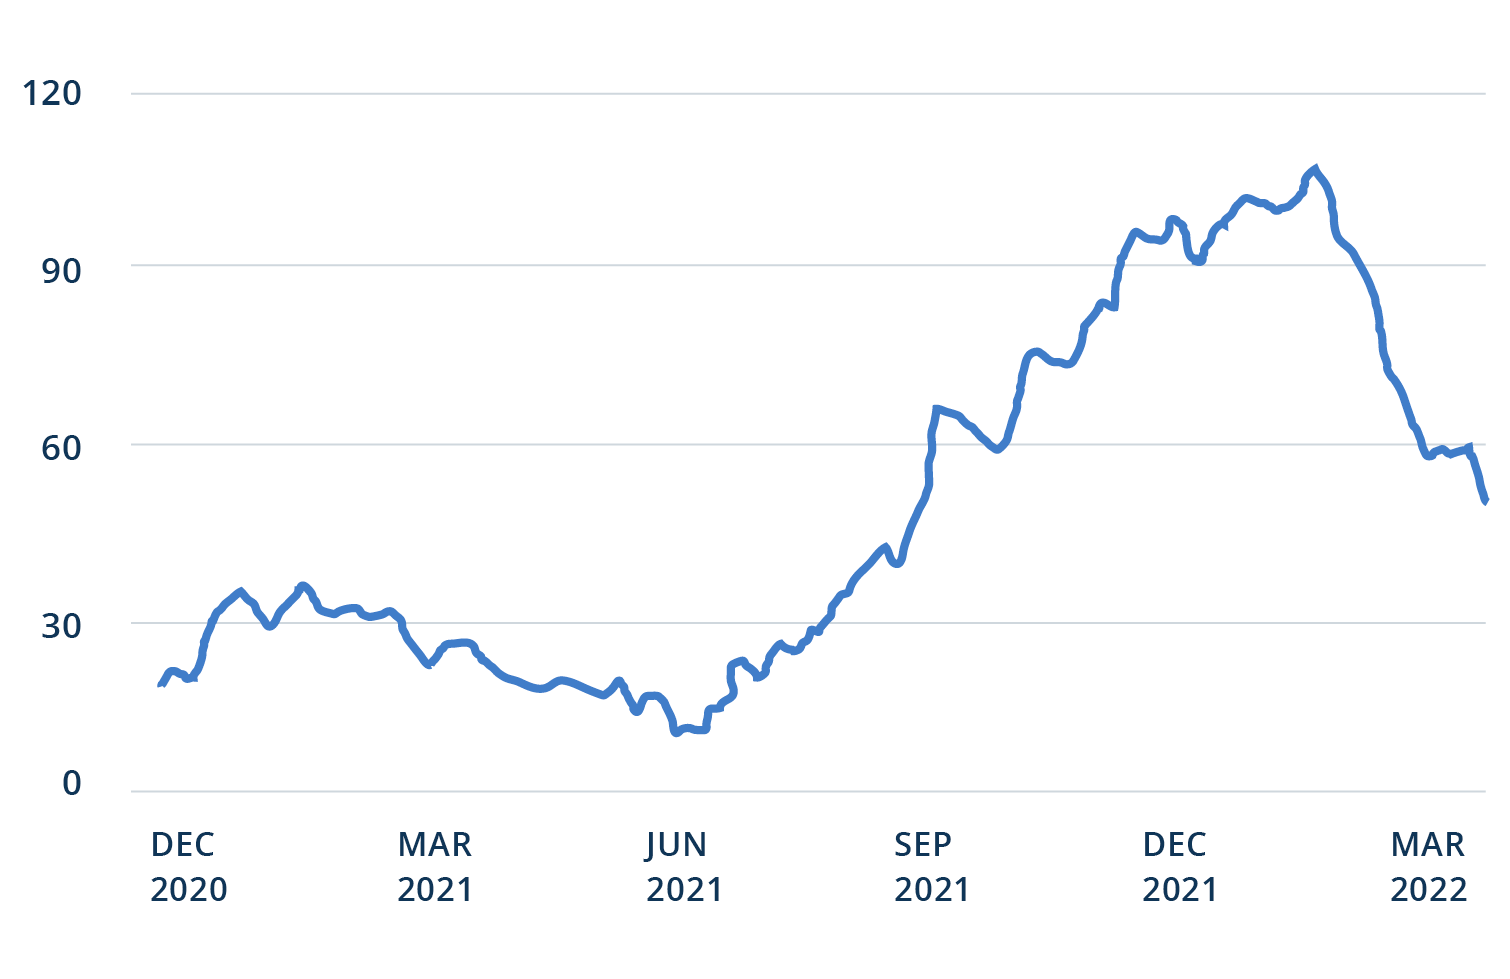
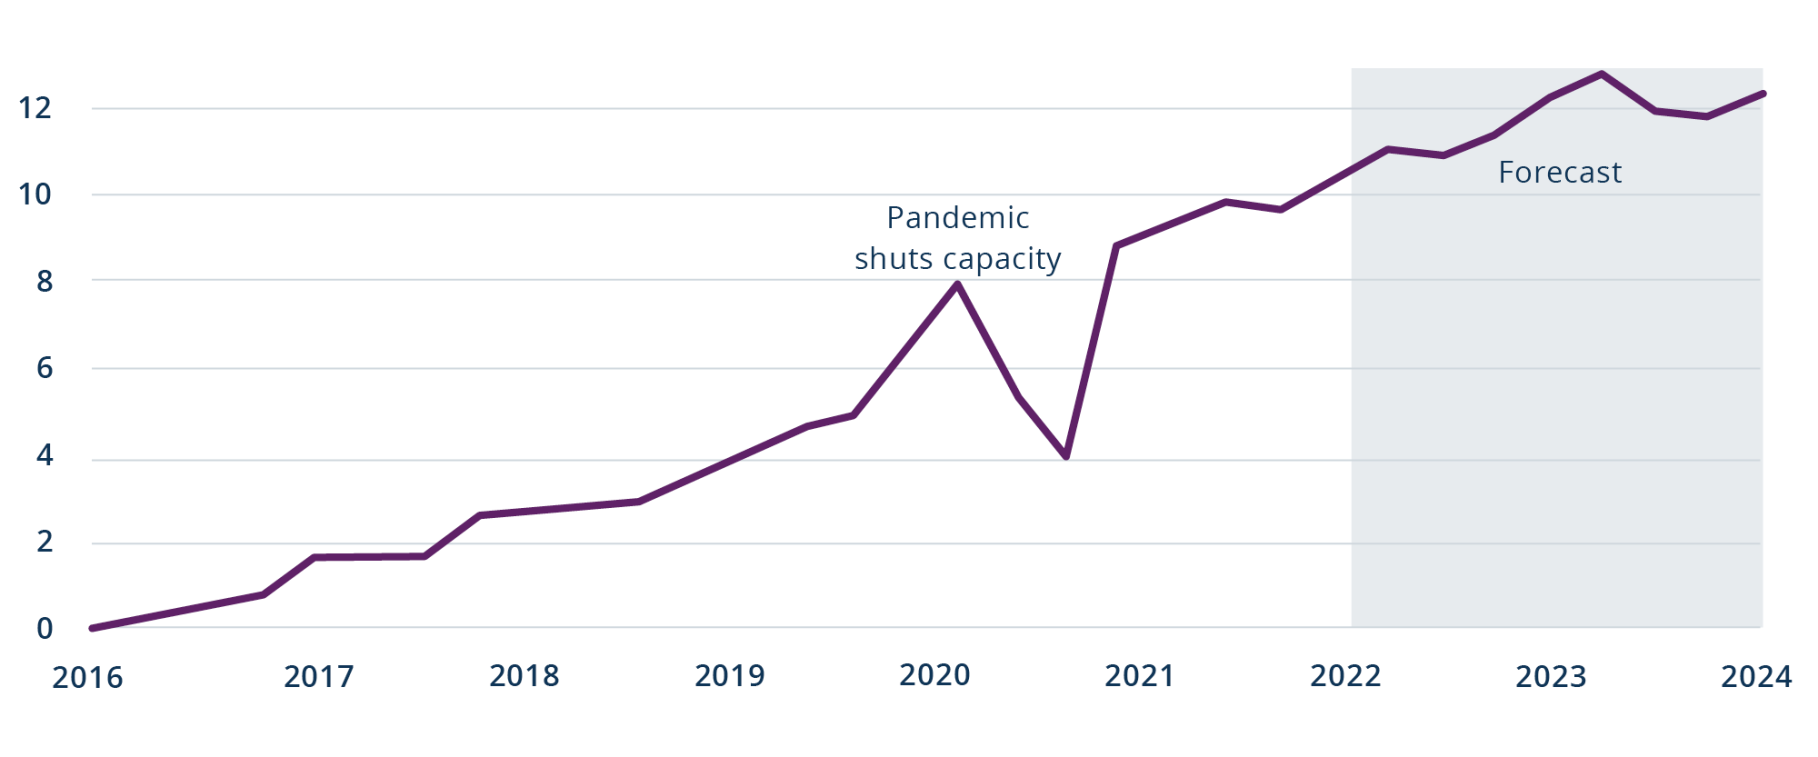
Because 10-year Treasury yields are so closely scrutinized, knowledge of its historical patterns is integral to understanding how today's yields fare as compared to historical rates. Below is a chart of the yields going back a decade.

While rates do not have a wide dispersion, any change is considered highly significant. Large changes of 100 basis points can, over time, redefine the economic landscape. The yield curve has been flattening at an accelerated pace, which could be construed as a worry over economic growth and investor uncertainly regarding monetary policy.7

Perhaps the most relevant aspect is in comparing current rates with historical rates, or following the trend to analyze whether near-term rates will rise or fall based on historical patterns. Using the U.S. Treasury website, investors can easily analyze historical 10-year Treasury bond yields. 

Factors that Affect the 10-Year Treasury Yield

There are many factors that affect the 10-year yield, the most substantial being investor sentiment. When investors have high confidence in the markets and believe they can profit outside of Treasury securities, the yield will rise as the price falls. This sentiment is determined by both the individual investor and investors as a whole, and can be based on any number of factors such as economic stability, geopolitical fluctuations, war, and more.

A decline in the 10-year yield indicates caution in the markets and the future of the global economy. Conversely, gains in the yield signal confidence.8

Interest rates are another significant factor. Since they are the benchmark from which all other rates are derived, they have a direct impact on yields. When the Federal Reserve lowers its key interest rate, it drives demand for Treasury securities.

Inflation has an effect on yields as well. Treasury yields rise when fixed-income products become less desirable. Over time, central banks will adjust (raise) their interest rates to combat inflationary pressure.

Can You Lose Money on Treasury Bills?

The short answer is no, as your principal is protected by the government. However, Treasury bills are highly subject to inflationary pressure. If an investor were to purchase a bond today, and then inflation picks up, the purchasing power of their principal will be severely diminished by the time their security reaches expiration. Even though that investor receives their principal plus interest, they are in effect losing money due to the money being worth less when they withdraw it.

What Does the 10-Year Treasury Yield Mean?

The 10-year Treasury yield is the yield that the government pays investors that purchase the specific security. Purchase of the 10-year note is essentially a loan made to the U.S. government. The yield is considered a marker for investor confidence in the markets, shining a light on whether investors feel they can make a higher return than the yield offered on a 10-year note by investing in stocks, ETFs, or other riskier securities.

What Factors Affect the 10-Year Treasury Yield?

Some factors that affect the 10-year Treasury yield are inflation, interest rate risk, and investor confidence in both the Treasury security and the overall economy.

The Bottom Line

The 10-year Treasury yield is used to determine investor confidence in the markets. It moves to the inverse of the price of the 10-year Treasury note and is considered one of the safest—if lowest returning—investments that can be made. Although the investment is guaranteed by the U.S. government, investors could still lose money if inflation outpaces the 10-year yield.

----------------------------------------------------
Source
https://www.investopedia.com/articles/investing/100814/why-10-year-us-treasury-rates-matter.asp#:~:text=The%2010%2Dyear%20yield%20is,risk%2C%20higher%2Dreward%20investments.

Saturday, August 20, 2022

Transport Infrastructure: Four Themes to Watch

Transport Infrastructure: Four Themes to Watch

Introduction

The steady stream of news about supply chain bottlenecks has put a spotlight on the essential nature of transport infrastructure and logistics assets around the world.

While the peak of the supply chain disruption is likely behind us, it exposed problems that persist, such as outdated infrastructure and insufficient capacity, flexibility and efficiency.

Yet, supply chain resilience is just the first big theme to watch in this space (see Figure 1). As e-commerce continues to grow and fundamentally changes the way goods move, transport logistics businesses will need to adapt. These businesses will also need to “green up” their assets and networks to meet emission reduction targets and emerging environmental regulations as global decarbonization initiatives take hold. Finally, changing mobility patterns will require advances in technology to unlock new time-saving and cost-effective options, catering to evolving passenger preferences.

Critical transport assets—road, rail, air, marine, logistics infrastructure and integrated networks—require substantial capital to eliminate inefficiencies, increase network capacity, decarbonize and provide greater reliability.

Investments are necessary to make supply chains more resilient—and to address significant expected changes in e-commerce, decarbonization and mobility. The last few years have also demonstrated the critical role logistics equipment networks play in global supply chains. But from an investor’s standpoint, large capital requirements often create attractive opportunities.

In addition, today’s elevated inflation and tight commodity environment further underscore the critical nature of transport infrastructure to the global economy—and the need for further investment.

Figure 1: Four Themes to Watch in Transport Infrastructure

Key Themes

Figure 1: Four Themes to Watch in Transport Infrastructure

The Need for Supply Chain Resilience

Over the last several decades, manufacturers embraced “just-in-time” manufacturing, where parts were delivered to factories as they were required, minimizing the need to stockpile them.

This allowed manufacturers to stay nimble and cut costs. But when the Covid-19 pandemic hit, supply chains struggled to keep up with rising demand as factories shut down and global trade was disrupted.

As a result, manufacturers are now shifting to a “just-in-case” inventory model, and tenants of logistics facilities are looking to secure more warehouse space to accommodate this safety stock. Consequently, inbound and outbound transportation networks will need to be rebuilt to provide redundancy, flexibility and security.

Approximately 90% of world trade moves by sea; yet, because of backups and delays, the movement of freight using existing infrastructure and equipment slowed significantly during the pandemic (see Figures 2 and 3). This meant that high demand for goods met labor disruptions at ports, warehouses and trucking companies—causing reduced asset throughput and turn times, which tightened available capacity and resulted in a backlog.

Figure 2: The Percentage of Shipping Vessels Arriving on Time Has Plunged…

Figure 2: The Percentage of Shipping Vessels Arriving on Time Has Plunged…
Source: Bloomberg and Sea-Intelligence

Figure 3: …While Ports Have Remained Congested

Port Congestion Index, % Difference Between Current Level and Five-Year Avg.

Figure 3: …While Ports Have Remained Congested
Source: Clarksons, Morgan Stanley Research as of February 2022

With lower asset utilization, the price of capacity—for shipping, rail, air and trucking—has jumped higher (see Figure 4).

For example, at the U.S. ports of Los Angeles and Long Beach—key U.S. gateways for Asian imports—outdated infrastructure and an inability to operate 24/7 at some terminals have contributed to severe congestion. In fact, the number of vessels lined up outside those terminals has become a barometer of worldwide supply chain disruption. That queue still exists, but the number of vessels waiting today is now more than 50% lower than the January 2022 peak (see Figure 5). Nevertheless, customers have been willing to pay a significant premium for guaranteed capacity—and from a long-term perspective, are looking for ways to control more of their inbound supply chain.

To make ports more resilient in managing such volumes, they will need to modernize and become more efficient through technology and automation. To make these improvements on a global scale, more investment is needed in agile, tech-enabled logistics and supply chain infrastructure. Brookfield’s investments in Patrick Terminals, Australia’s largest container terminal operator, and TraPac, a U.S. west coast container terminals business, provide examples of this approach. The Port of Rotterdam in the Netherlands is another example.

Figure 4: The Price of Capacity Has More Than Tripled in Two Years

Global Freight Rate Index

Figure 4: The Price of Capacity Has More Than Tripled in Two Years
Source: Citi Research, CCFI

Figure 5: Congestion Is Easing at the Port of Los Angeles/Long Beach

No. of Anchored/Loitering Ships

Figure 5: Congestion Is Easing at the Port of Los Angeles/Long Beach
Source: The Port of Los Angeles, BofA Global Research

The Growth of E-Commerce

For years, supply chain managers sought to reduce inventories. However, the pandemic accelerated a shift in spending, with consumers spending more on goods—especially online—and less on services.

Consider the ratio of inventories to sales, which indicates the number of months of inventory that are on hand relative to the sales for a month. After averaging 1.47 from 2015 to 2019, this ratio has declined significantly since the start of the pandemic to 1.16 as of March 2022 (see Figure 6).

Online activity puts tremendous pressure on transportation networks. It requires a high degree of supply chain dependability, faster “speed to market” and a shortening of supply chains. A generation of consumers has come to expect that almost anything they order online can be delivered the same day or overnight, underscoring the criticality of last-mile delivery networks.

Meeting those expectations will require reevaluating the importance of inventory buffers and the location of critical assets, considerations that are beyond cost. As a result, companies like Amazon and Walmart are increasingly interested in owning critical infrastructure to help secure their supply chains as they review how goods are moving from Point A to Point B.

As e-commerce penetration levels continue to increase, current inventories need to be boosted significantly, above pre-pandemic levels. And much of the transportation networks, software and systems must be updated and redesigned for this new reality.

Figure 6: More Inventory Is Needed

Figure 6: More Inventory Is Needed
Source: U.S. Census Bureau

A generation of consumers has come to expect that almost anything they order online can be delivered the same day or overnight, underscoring the criticality of last-mile delivery networks.

The Global Shift to Decarbonization

The growing urgency around decarbonization has pushed many transport firms to announce—and accelerate—net-zero targets.

For example, Maersk, the world’s second-largest shipping line by container capacity, is bringing forward a target to cut carbon from its operation by a decade—to 2040, instead of 2050, as it responds to growing demand from companies such as Amazon, Ikea and Unilever for an emissions-free supply chain.1  In the coming years, many transport businesses will need to invest substantial capital to transition their assets and business models to meet emissions targets and emerging environmental regulations.

The transport sector accounts for approximately 24% of all CO2 emissions worldwide2 and will need to reduce those emissions by two-thirds to meet a 1.5 degrees Celsius warming scenario by 2050.3

At the same time, as the energy transition accelerates—and as security of energy supply increasingly factors into the conversation—demand is rising for the transportation and storage of lower-carbon-emitting commodities, such as natural gas and hydrogen (see Figures 7 and 8).

Figure 7: Demand Is Trending Up for Liquefied Natural Gas

Figure 7: Demand Is Trending Up for Liquefied Natural Gas
Source: Cheniere Research, Kpler, Bloomberg

Figure 8: Europe’s 4x Upgrade to Green Hydrogen Production by 2030

Figure 8: Europe’s 4x Upgrade to Green Hydrogen Production by 2030
Source: EU Commission, Goldman Sachs Global Investment Research

“Desperate to wean itself from Russian oil and gas,” the Financial Times remarked on April 13, “and wilting under soaring energy prices, Europe has rediscovered its thirst for American LNG” (see Figure 9).4

Emissions reduction targets can be achieved through a combination of electrification, advanced fuels and improved materials. For example, a container terminal at a port will need to replace diesel-fired equipment with zero-emissions cargo handling equipment. Furthermore, transport equipment (e.g., ships, trains and planes) will also need to move away from diesel. Energy sources such as hydrogen biofuels will be a critical alternative option for heavy modes of transport, whereas electrification may serve as the more economic and environmental solution for lighter transport vehicles.5  Biofuels are also likely to play a role in the beginning phases of the energy transition.

Positioning these assets for the modern energy economy represents a significant opportunity. In working to “green up” their logistics networks, companies will seek providers of energy-efficient forms of transportation infrastructure with capital and operating expertise.

Figure 9: U.S. Liquefied Natural Gas Exports Are Forecast to Continue Rising

Cubic Feet Per Day (Bil.)

Figure 9: U.S. Liquefied Natural Gas Exports Are Forecast to Continue Rising
Source: Financial Times and U.S. Energy Information Administration (EIA)
TraPac

Changing Mobility Patterns

The pandemic shifted mobility patterns, with more time being spent at or near the home—and far less time in the air (see Figure 10).

Even in a post-pandemic future, where and how people travel are likely to evolve, especially with advances in technology. One past example of this is how Uber and Lyft disrupted the taxi industry by leveraging technology to allow users to order cars on their phones, undercutting on price and offering more seamless methods of payment.

Today, technology and digital services are becoming even more important across transportation networks, and recent deal flow in this space illustrates this. For example, in January 2022, Italian toll road group Atlantia acquired Yunex Traffic, a unit of Siemens, for €950 million.6  Yunex provides “intelligent” traffic solutions—such as tunnel automation, smart tolling and adaptive traffic systems for simulation and prediction—in over 600 cities. The transaction demonstrates how current and expected changes in the mobility sector will make it necessary to create new infrastructure and services to manage traffic and control emissions within and outside urban centers.

Advances in technology, and the electrification of aircraft, might also make urban air mobility investable in the years to come—especially if it’s quiet, cheap and safe. The development of electric vertical take-off and landing aircraft could ease urban congestion—especially in growing cities that might be limited by public sector infrastructure.7 Big issues must be addressed before we reach that point, such as public acceptance, as well as certification by aviation regulators. If the urban air mobility industry does take off, the buildout of landing infrastructure—perhaps on the top of multistory parking garages or office buildings—will be required.

Figure 10: U.S. Corporate Air Travel Remains ~33% Below 2019 Levels

Ticket Volume Growth

Figure 10: U.S. Corporate Air Travel Remains ~33% Below 2019 Levels
Source: BofA Global Research Airlines Overview by Andrew George Didora

Conclusion

The past few years have highlighted the importance and critical nature of transport infrastructure. To bolster current networks, additional capacity and substantial investment will be required, driven by the key trends influencing the sector—including supply-chain challenges, the continued growth of e-commerce, the shift to decarbonization and increasing mobility. Because many governments now have heavily indebted balance sheets, the private market is poised to play a prominent role in providing much-needed capital.

Critical and stable infrastructure assets may benefit from many of the macroeconomic trends that are prevalent in today’s markets, including higher volumes, rising inflation, strong commodity prices and reduced capacity due to supply chain bottlenecks.

Essential and large-scale transport infrastructure businesses have other advantages. They generally have a preferred and captive geographic location or corridor, high initial fixed-cost investment and low non-variable operating costs. These attributes can result in high margins and significant barriers to entry. For example, mature toll road assets, according to a December 2021 report from BofA Global Research, typically report EBITDA margins in the range of 60–75%, with some assets exceeding 80%.8

And despite the congestion, the Port of Los Angeles last year broke its 2018 record for annual containerized imports by 13%.9 Container terminal business can still benefit when there are delays—for example, by collecting additional demurrage revenues. Finally, when the demand for logistics infrastructure is high, scaled businesses can realize higher tariffs as customers compete for limited capacity.

As with any investment, there is always risk to consider. For example, transport infrastructure is often GDP-sensitive, with revenues driven by economic growth. However, the essential nature of the assets, strong pricing power and a positive long-term demand outlook tend to mitigate this risk.

Looking ahead, we expect transport infrastructure companies to increasingly seek partners who can provide capital, along with operational expertise, and have seen the durability of these assets first-hand through different economic cycles and periods of disruption. These are the tools they will need to build stronger, resilient assets and larger, more efficient networks.

GWR

Endnotes:

1. Maersk, “A.P. Moller - Maersk accelerates Net Zero emission targets to 2040 and sets milestone 2030 targets,” 12 January 2022.
2. International Energy Agency (IEA), “CO2 emissions by sector, World 1990-2019.”
3. International Transport Forum, “ITF Transport Outlook 2021.”
4. Financial Times, “Biden and Ukraine: from climate champion to oil price panic,” 13 April 2022.
5. Shell, Deloitte, “Decarbonizing road freight: Getting into gear” 2021.
6. Atlantia, “Atlantia agrees acquisition of Yunex Traffic from Siemens,” 17 January 2022.
7. Financial Times, “Air taxis: flight of fantasy or truly set for lift off?” January 30, 2022.
8. BofA Global Research, “Launching on Infrastructure: Entering a €2tn stimulus ‘Golden Era,’” 10 December 2021.
9. Port of Los Angeles, “Port of Los Angeles Breaks Cargo Record in 2021, Sets Priorities for 2022,” 20 January 2022.

Disclosures

This commentary and the information contained herein are for educational and informational purposes only and do not constitute, and should not be construed as, an offer to sell, or a solicitation of an offer to buy, any securities or related financial instruments. This commentary discusses broad market, industry or sector trends, or other general economic or market conditions. It is not intended to provide an overview of the terms applicable to any products sponsored by Brookfield Asset Management Inc. and its affiliates (together, "Brookfield").

This commentary contains information and views as of the date indicated and such information and views are subject to change without notice. Certain of the information provided herein has been prepared based on Brookfield's internal research and certain information is based on various assumptions made by Brookfield, any of which may prove to be incorrect. Brookfield may have not verified (and disclaims any obligation to verify) the accuracy or completeness of any information included herein including information that has been provided by third parties and you cannot rely on Brookfield as having verified such information. The information provided herein reflects Brookfield's perspectives and beliefs.

Investors should consult with their advisors prior to making an investment in any fund or program, including a Brookfield-sponsored fund or program.

-------------------------------------------------
Source

https://www.brookfield.com/insights/transport-infrastructure-four-themes-watch