Search This Blog

Tuesday, June 28, 2022

The Crowd: A Study of the Popular Mind – Gustave Le Bon

The Crowd: A Study of the Popular Mind – Gustave Le Bon

Get a FREE membership video! Subscribe to our Newsletter.

The following is a transcript of this video.

The nature of crowds has long been a topic of interest in philosophy. However, the 18th and 19th centuries were a time when an increased emphasis was placed on understanding the psychology of crowds. For example,  the 18th century philosopher Jean Jacques Rousseau proclaimed that  “…we have a very imperfect knowledge of the human heart if we do not also examine it in crowds.”

Gustave Le Bon (1841-1931), a French social psychologist, is often seen as the father of the study of crowd psychology. Le Bon believed an understanding of crowd psychology was essential for a proper understating of the both history and the nature of man. As he wrote in his classic and highly influential work The Crowd: A Study of the Popular Mind: 

“It is crowds rather than isolated individuals that may be induced to run the risk of death to secure the triumph of a creed or an idea, that may be fired with enthusiasm for glory and honour… Such heroism is without doubt somewhat unconscious, but it is of such heroism that history is made.”(The Crowd: A Study of the Popular Mind – Gustave Le Bon)

In this video we will provide a summary of Le Bon’s classic work. In particular, we will investigate his insights into the nature of crowds, look at the role ideas play in influencing crowds, examine the  religious sentiment of crowds, and discuss  the psychological and emotional benefits one derives from joining a crowd.

What is a crowd? Le Bon defined a crowd as a  group of individuals united by a common idea, belief, or ideology.

The idea which unites a crowd is not chosen by a process of clear reasoning and examination of evidence. Instead, as we will discuss in more detail later, crowds accept beliefs and ideas superficially and utilize them as fuel for revolutionary action.

When an individual becomes part of a crowd, according to Le Bon, he undergoes a profound psychological transformation. That is, he  ceases to operate as an individual: 

“He is no longer himself, but has become an automaton who has ceased to be guided by his will.” (The Crowd: A Study of the Popular Mind – Gustave Le Bon)

With such a psychological transformation, an individual no longer lives for himself, but instead becomes a pawn who sacrifices his own personal ends and goals in favour of those of the crowd:

“In a crowd every sentiment and act is contagious, and contagious to such a degree that an individual readily sacrifices his personal interest to the collective interest.” (The Crowd: A Study of the Popular Mind – Gustave Le Bon)

As was mentioned earlier, Le Bon maintained that a crowd forms when an  influential idea unites a number of individuals and propels them to act towards a common goal. These influential ideas, however, are never created by members of the crowd. Instead,  they are brought into the world by the minds of great individuals.

Since those who compose a crowd are by their very nature mediocre, they are incapable of understanding these ideas in their  original form. Therefore, in order for an idea to unite and influence a crowd,  it must first be thoroughly simplified:

“Ideas being only accessible to crowds after having assumed a very simple shape must often undergo the most thoroughgoing transformations to become popular. It is especially when we are dealing with somewhat lofty philosophical or scientific ideas that we see how far-reaching are the modifications they require in order to lower them to the level of the intelligence of crowds…. However great or true an idea may have been to begin with, it is deprived of almost all that which constituted its elevation and its greatness by the mere fact that it has come within the intellectual range of crowds and exerts an influence upon them.” (The Crowd: A Study of the Popular Mind – Gustave Le Bon)

For example, a great philosopher could extol  the nature of liberty in an 800 page masterpiece. However, the crowd, incapable of comprehending such thoughts, would require the  concept of liberty to be thoroughly simplified in order for it to stimulate revolutionary action. Le Bon proposed that  this is where leaders come in. For it is the leader of a crowd who communicates simplified ideas to the crowd and in doing so unites it together and stimulates it to act. 

“The majority of men, especially among the masses, do not possess clear and reasoned ideas on any subject whatever outside their own specialty. The leader serves them as guide.” (The Crowd: A Study of the Popular Mind – Gustave Le Bon)

In the modern day one can see how invigorated and rejuvenated crowds become when they hear a leader pronounce that a cause is being  fought in the name of freedom, peace, or prosperity. Once these words are proclaimed the members of the crowd nod their heads in blind obedience to whatever else follows from the leader’s mouth – completely ignorant as to the corrupt purposes that may be the true guide for the leader’s  actions.

“How numerous are the crowds that have heroically faced death for beliefs, ideas, and phrases that they scarcely understood!”(The Crowd: A Study of the Popular Mind – Gustave Le Bon)

Referring to the ideas which leaders manipulate in order to govern and control crowds, Le Bon wrote:

“By many they are considered as natural forces, as supernatural powers. They evoke grandiose and vague images in men’s minds, but this very vagueness that wraps them in obscurity augments their mysterious power. They are the mysterious divinities hidden behind the tabernacle, which the devout only approach in fear and trembling.”(The Crowd: A Study of the Popular Mind – Gustave Le Bon)

Approaching these simplified, and therefore gravely misunderstood, ideas as mysterious divinities, a crowd always forms a  religious relationship to the ideas which motivate them to action. This being the case even when the ideas have no explicitly religious component:  “A person is not religious solely when he worships a divinity, but when he puts all the resources of his mind, the complete submission of his will, and the whole-souled ardour of fanaticism at the service of a cause or an individual who becomes the goal and guide of his thoughts and actions.”

Along this line of reasoning Le Bon continued:

“Were it possible to induce the masses to adopt atheism, disbelief would exhibit all the intolerant ardour of a religious sentiment, and in its exterior forms would soon become a cult.”(The Crowd: A Study of the Popular Mind – Gustave Le Bon)

While crowds are capable of acts which achieve both good and evil, Le Bon believed that more often than not  crowds commit barbarous and immoral actions.  Why do crowds so often act in an immoral manner?

Le Bon put forth the following explanation:  “…our savage, destructive instincts are the inheritance left dormant in all of us from the primitive ages. In the life of the isolated individual it would be dangerous for him to gratify these instincts, while his absorption in an irresponsible crowd, in which in consequence he is assured of impunity, gives him entire liberty to follow them.”

The 20th century  psychologist Carl Jung reiterated this idea:

“…if people crowd together and form a mob, then the dynamisms of the collective man are let loose – beasts or demons that lie dormant in every person until he is part of a mob. Man in the mass sinks unconsciously to an inferior moral and intellectual level, to that level which is always there, below the threshold of consciousness, ready to break forth as soon as it is activated by the formation of a mass.” (Carl Jung)

(Check out our 2-part video mini-series on Carl Jung)

Nonetheless, Le Bon believed he understood what motivated individuals to join a crowd.

When an individual lives his life as an individual – that is, when he forced to take responsibility for his life – he is apt to feel a crushing burden and sense of impotence he can’t seem to shake.

In joining a crowd or a mass movement, the individual is temporarily relieved of this responsibility and sense of impotence, and comes to feel that he is capable of shaking the foundations of the earth:

“In crowds the foolish, ignorant, and envious persons are freed from the sense of their insignificance and powerlessness, and are possessed instead by the notion of brutal and temporary but immense strength.”(The Crowd: A Study of the Popular Mind – Gustave Le Bon)

Le Bon thought that we are all in a sense a part of a crowd, as we are all  motivated by ideas and ideologies which are socialized into us and via communal action unite us with others in our culture. Many of our actions, in other words,  are motivated by ideas, beliefs, and ideologies which we do not understand. Le Bon thought it was impossible to fully extricate one’s self from all of these implicit ideas.  Yet he did maintain that partial freedom and independence can be attained by bringing to the light of reason the ideas, values, and beliefs which guide our actions. For as Le Bon  wisely claimed:

“The tyranny exercised unconsciously on men’s minds is the only real tyranny, because it cannot be fought against.”(The Crowd: A Study of the Popular Mind – Gustave Le Bon)

Be sure to supplement your knowledge of crowds with information about how those in power use fear as a means of social control.


Monday, June 20, 2022

McClellan Summation Index

McClellan Summation Index

Introduction

Developed by Sherman and Marian McClellan, the McClellan Summation Index is a breadth indicator derived from the McClellan Oscillator, which is a breadth indicator based on Net Advances (advancing issues less declining issues). The Summation Index is simply a running total of the McClellan Oscillator values. Even though it is called a Summation Index, the indicator is really an oscillator that fluctuates above and below the zero line. As such, signals can be derived from bullish/bearish divergences, directional movement and centerline crossovers. A moving average can also be applied to identify upturns and downturns.

Calculation

Previous day's Summation Index* + current day McClellan Oscillator

* The very first Summation Index is simply the value of the McClellan Oscillator.

StockCharts.com provides two options for the McClellan Summation Index: unadjusted and ratio-adjusted. Net Advances is the base indicator used to calculate the McClellan Oscillator (and, by extension, the Summation Index); it is derived from the number of advancing issues less the number of declining issues. This number is used to calculate the “traditional” Summation Index. Ratio-adjusted Net Advances equals Net Advances divided by advances plus declines. This shows Net Advances relative to the total, which makes it possible to compare values over a long period of time. This article focuses on the Ratio-adjusted Summation Index. See the McClellan Oscillator article for more details on ratio-adjusted Net Advances.

Interpretation

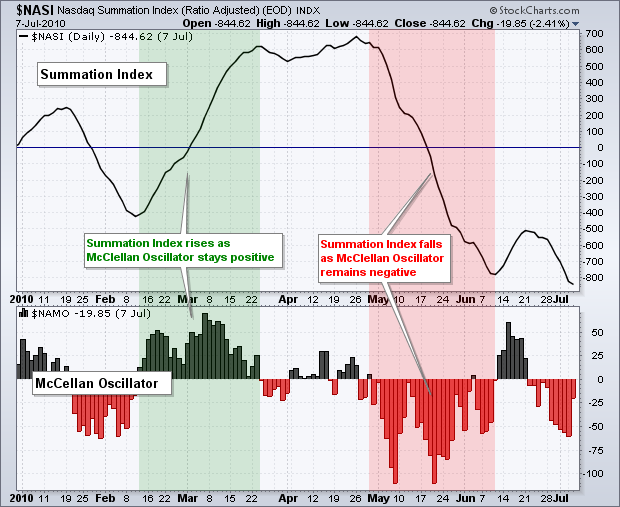
The Summation Index rises when the McClellan Oscillator is positive and falls when the McClellan Oscillator is negative. Extended positive numbers in the McClellan Oscillator cause the Summation Index to trend higher. Conversely, extended negative readings cause the Summation Index to trend lower.

Because of its cumulative nature, the Summation Index is a slower version of the McClellan Oscillator. The index crosses the zero line fewer times, forms divergences less often and produces fewer signals in general. Whereas the McClellan Oscillator can be used for short-term and medium-term timing, the Summation Index is generally used for medium-term and long-term timing.

There are three basic signals. First, the Summation Index generally favors the bulls when positive and the bears when negative. Second, chartists can look for bullish and bearish divergences to anticipate reversals. Third, chartists can identify directional movement to define a bullish or bearish bias.

Nasdaq Negative Bias

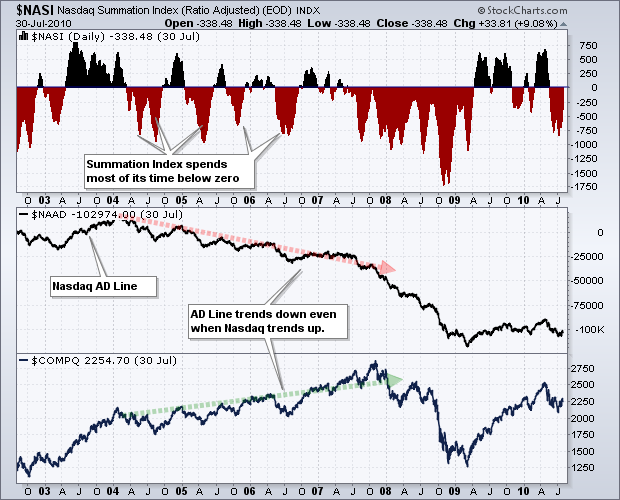
Before looking at specific signals, note that the Nasdaq Summation Index has a long-term downward bias. This is because the Nasdaq AD Line also has a long-term downward bias. This bias stems from listing requirements that are not as stringent as NYSE. The Nasdaq is full of upstarts in industries ranging from biotech to technology to alternative energy. There may be big upside potential, but there is also a risk of absolute failure and delisting. Stocks trend lower as failure becomes an option. Companies that fail are ultimately removed from the index, but their negative effect on these breadth indicators remains.

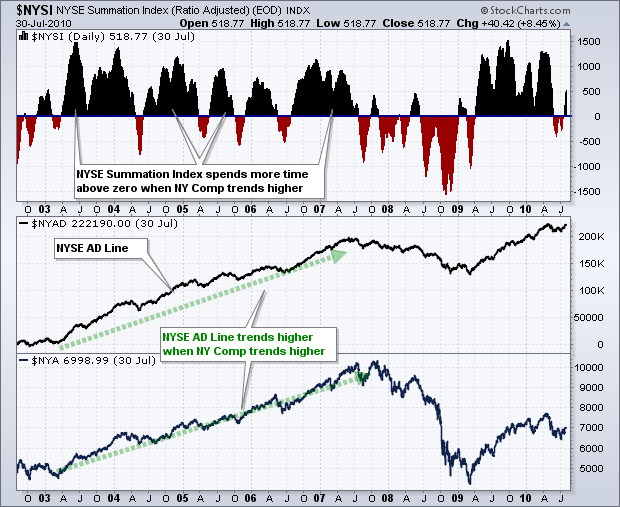
This negative bias does not affect short-term or medium-term movements, but it is clearly visible on long-term charts. The charts above show the Nasdaq Summation Index ($NASI) and the NYSE Summation Index ($NYSI) from August 2002 until August 2010 (eight years). Notice how the Nasdaq moved higher from 2003 until 2007. Despite a multi-year uptrend in the Nasdaq, the Nasdaq Summation Index spent more time in negative territory and the Nasdaq AD Line trended lower. The NY Composite also moved higher from 2003 until 2007. In contrast to the Nasdaq version, the NYSE Summation Index spent more time in positive territory and the NYSE AD Line trended higher the entire time (green trend line).

Positive vs. Negative

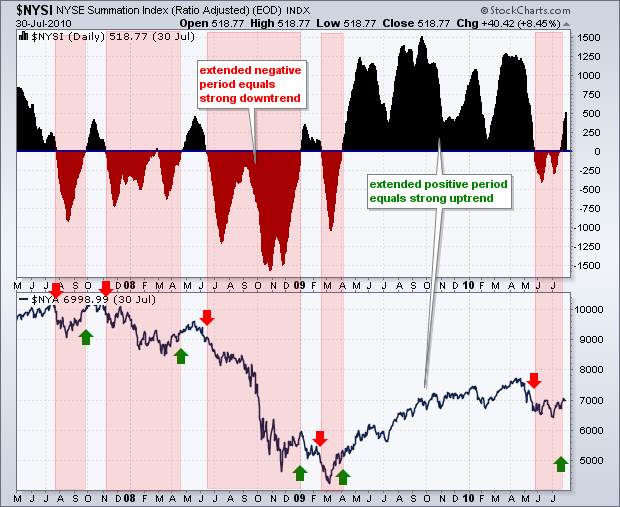
Like many momentum oscillators, the Summation Index provides a bullish or bearish bias when it is above or below its center line (zero). This is logical because the glass is half full when positive and half empty when negative. The Summation Index will be positive when the McClellan Oscillator has been largely positive for an extended period of time. It takes more than one positive/negative reading to push the Summation Index into positive/negative territory. In fact, it usually takes several positive readings to push the Summation Index into positive territory and keep it in positive territory. This is why the Summation Index is better suited for medium-term or long-term analysis.

The chart below shows the NYSE Summation Index with the NY Composite. The red highlights show when the indicator moved into negative territory and remained negative. Sustained negative values from June to December 2008 coincided with an extended downtrend in the NY Composite. Conversely, extended positive values from April to May 2009 coincided with a sustained uptrend in the NY Composite. Like ALL indicators, the Summation Index is not perfect. There will be whipsaws or periods when zero line crossovers do not last long.

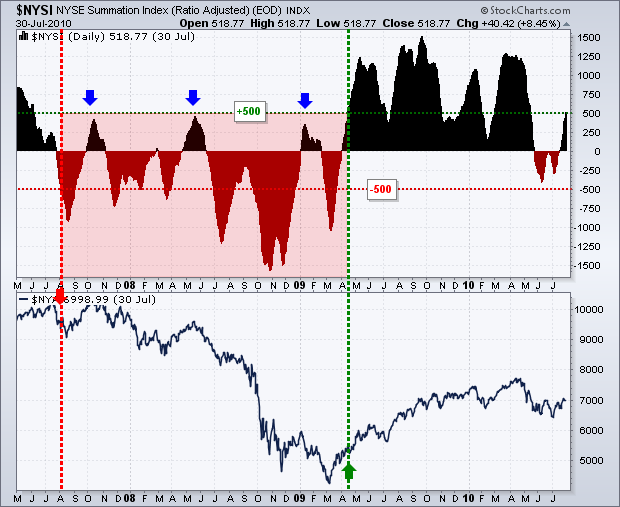
Chartists can also tweak the positive and negative values required for a bullish or bearish bias. The next chart shows the same time period for the NYSE Summation Index and NY Composite. Instead of the zero line, the bullish threshold is set at +500 and the bearish threshold is set at -500. A long-term bull signal is triggered when the Summation Index moves above +500 and remains valid until the index moves below -500. Similarly, a long-term bear signal is triggered when the Summation Index moves below -500 and remains valid until the index moves above +500. Instead of 10 signals in three years using the zero cross, there were only two signals using the +500/-500 cross. The Summation Index captured the long downtrend from August 2008 until April 2009 and the long uptrend from April 2009 until July 2010 (and counting). Notice how the area between 300 and 500 acted as resistance in 2007 and 2008 (blue arrows). Similarly, the -300 to -500 area acted as support in June 2010.

Directional Movement

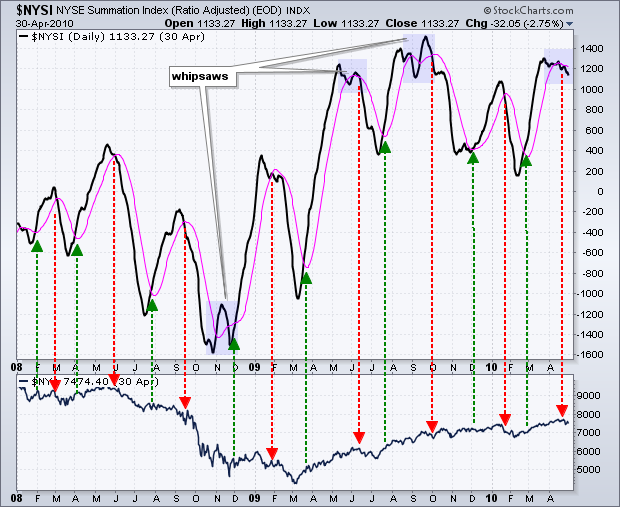
A moving average can be applied to the Summation Index to identify upturns and downturns. The length of the moving average depends on your trading or investing style and timeframe. A short moving average (5-days) will generate quicker signals, but there will be more whipsaws. A longer moving average (20-days) will lag a bit and there will be fewer whipsaws. It is the eternal tradeoff in technical analysis. More speed means more whipsaws. Less speed reduces whipsaws at the expense of later entries.

The chart below shows the NYSE Summation Index with a 20-day SMA (pink). Even with this medium-term moving average, there are still plenty of signals and turns. Some signals were great, some were not and some produced whipsaws. The orange areas highlight whipsaws when there were three moving average crosses within a relatively short timeframe.

Divergences

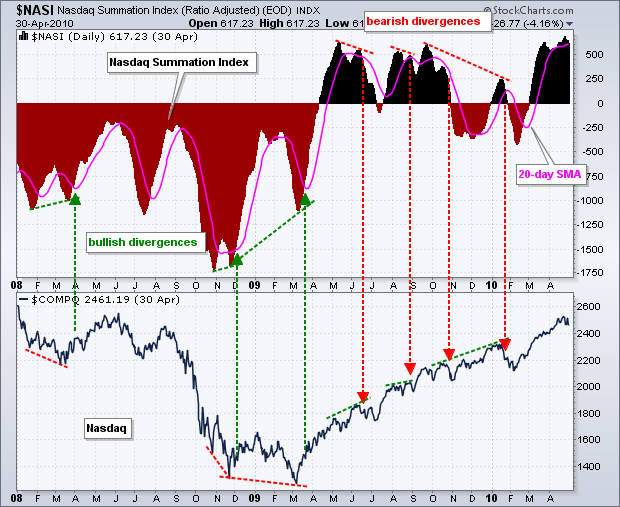
Bullish and bearish divergences in the Summation Index can help foreshadow reversals in the underlying index. However, not all divergences result in reversals or extended moves. The key, as always, is to separate robust divergences from weak divergences. A bullish divergence occurs when the Summation Index forms a higher low and the index forms a lower low. Even though the underlying index moved to new lows, the higher low in the Summation Index shows improving breadth. A bearish divergence forms when the Summation Index records a lower high and the index forges a higher high. Even though the underlying index moved to a new high, the Summation Index failed to exceed its prior high and showed deteriorating breadth.

Chartists should attempt to differentiate between small insignificant divergences and larger robust divergences. In addition, bearish divergences in a strong uptrend are more likely to fail - as are bullish divergences in a strong downtrend. Shallow divergences that form over a few weeks are more suspect than steep divergences that form over 1-4 months.

The chart below shows the Nasdaq Summation Index with the Nasdaq. There were three bullish divergences in the first half of the chart and four bearish divergences in the second half. A 20-day SMA was added to confirm a subsequent movement in the direction of the divergences. For example, the vertical green lines show the Summation Index moving above the 20-day SMA after a bullish divergence. Except for the last bullish divergence, the bearish divergences were steeper and covered longer timeframes. Also, notice that the bullish divergences occurred during a strong uptrend. These divergences did hint at short pullbacks within this uptrend, but they did not foreshadow an extended decline or a major reversal.

Conclusions

While the McClellan Oscillator puts a little momentum into the AD Line, the Summation Index takes a little out by slowing down the oscillator. The Summation Index is also quite a few steps removed from the original indicator, which is Net Advances. In other words, it takes three separate calculations to produce Summation Index values. The first derivatives (steps) are the 19-day EMA of Net Advances and 39-day EMA of Net Advances. The second derivative is the McClellan Oscillator, which is the 19-day EMA of Net Advances less the 39-day EMA of Net Advances. The third derivative is the Summation Index, which is a cumulative McClellan Oscillator. Each additional calculation changes Net Advances from its original form. This is not always bad, but chartists should keep this in mind when comparing the Summation Index with the corresponding index, the Nasdaq or the NY Composite. As with all indicators, Summation Index signals should be confirmed with other indicators or technical analysis techniques.

SharpCharts

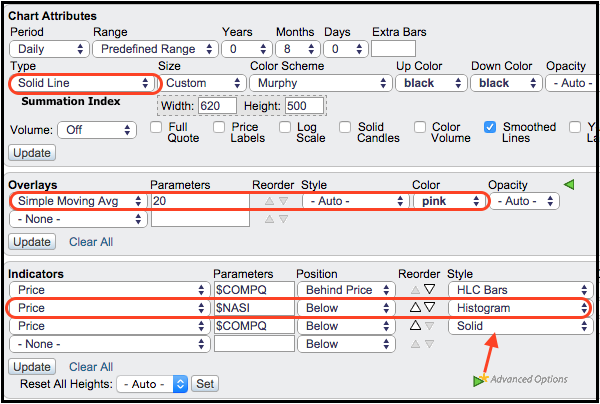
SharpCharts users can plot the Ratio-Adjusted Summation Index for the NYSE ($NYSI) or the Nasdaq ($NASI). The traditional (unadjusted) Summation Index symbols are $NYSIT and $NASIT, respectively. These indicators can be shown in the main chart window or in indicator windows above and below. The example below shows the Summation Index as a “line” plot in the main chart window with the underlying index behind it. This makes it easy to compare turns in the indicator with turns in the index. A 20-day SMA was added to the Summation Index to identify turns. Click here for a live example.

The Summation Index was also added as an indicator using the “Histogram” format. This makes it easy to identify crosses above and below the zero line. The underlying index (Nasdaq) is also shown in the lower window for comparison.

----------------------------------------------------
Source

https://school.stockcharts.com/doku.php?id=market_indicators:mcclellan_summation

Saturday, May 28, 2022

Is The Bear Market Getting Tired?

Is The Bear Market Getting Tired?

Is The Bear Market Getting Tired?

Print / Read as PDF

Last Friday I put out a special report titled, "Market at a Crossroad." To my analysis and the various market measurements that I have been presenting the last few weeks, it was sort of looking very extended to the downside. This is why I brought up the point that it was at a crossroads.

On one extreme, the people that are pushing for more downside are targeting some very low numbers for the S&P 500. Over the weekend, in Barron's, there was mention of 3,000 for a downside in the S&P. There were also more realistic washed-out levels being mentioned in the area of 3,700. Based on the low on Friday, EXACTLY at the 38.2 Fibonacci replacement number of 3,850, this number of 3,700 does not appear too out of the question. In simple math, that is only 3.8% from the 3,850 number. Hardly a big additional drop due to the extreme volatility in individual names since November of 2021. (see chart below)

Now that we have seen the recovery on Friday afternoon, and the action in equities, bonds, and the US Dollar on Monday, we could be getting the bounce that some were hinting at. Tuesday didn’t continue the bounce, but bottoms tend to be a process more than an event.

Bond yields have backed off from recent highs and the US Dollar seems to be saying that the high point in interest rates could have been seen for a bit. The US Dollar kept getting stronger and stronger as rates rose as it was a great hiding spot for foreign currency owners who wanted to get a double whammy of interest on their money and capital appreciation on the exchange rate.

Now, on Monday, the EU said that they were ready to move out above a negative interest rate environment. This means their rates finally rising and as such, pressure on an extended US Dollar trade. It has actually weakened for the last three trading days. Now, three days does not make a trend, but is how one can begin, or end as it may be in the short run. In the chart above, the US Dollar is seen clearly rolling over from its uptrend that has been in place for some time.  Given that a weaker US Dollar is better for pricing our exports, this could be the reason for a jump start in our broad market as it is the first glimpse of something positive on the global trading front. This being said, a softening US Dollar tends to be a headwind for energy and commodities in general, yet they have continued their uptrend. Given that the NASDAQ is down 30% from its highs, and in effect (except for the supply chain) there is nothing wrong with the domestic economy, there is certainly enough ammo for it to make a go to the upside. 

What we recognized last week was that in looking at the consumer, demand has not been the problem. Instead, the big box retailers that declared earnings said simply that they couldn't get what they wanted to be able to fill orders. Margins were being squeezed due to inflation at the commodity level and a higher cost of money in the form of higher interest rates also had an effect. The biggest consumer issue was the price of gasoline and diesel. As I've mentioned many times, fuel represents 20+% of American consumers' budgets. When you increase the cost of gasoline to $7 from $3 less than a year ago, this can really take the wind out of the discretionary spending sails.

As we hold our breath about gas prices not going any higher, I read an article about gas station owners needing to replace the digital readout panels on the gas pump to reflect a double-digit first number on the price! Think about it, when they first programmed the electronics they weren't expecting the first digit to the left of the decimal point to be above one digit! Coming back to the supply chain issue, this is something fixable. Companies want to produce and consumers across the globe want to consume, so as soon as the COVID variant scares diminish, we should be able to restock inventories and get production cycles back on course. 

Given the severity of the pullback we have experienced, I doubt that the recovery will be a straight-up V-bottom, but instead probably some kind of a bounce a sideways action, and then an eventual rally once we get through the normally difficult Midterm election year negativity. Midterm election years can be quite volatile with the average year down 17.1% from peak to trough, so a Bear market during this year isn't out of the ordinary. I have included an updated chart of where we are in the Midterm year so far this year. 

Knowing where we are and what normally occurs helps, but clearly isn't expected to do anything more than rhyme. Knowing this helps put this year's drop of 18.1% in perspective. The good news is a year off those lows, the S&P 500 has gained 32% on average, something most investors would likely take right about now! 

One additional point that I would like to make is that I understand how the market pullback has been a result of the four gremlins of: 1) inflation, 2) rising interest rates, 3) supply chain issues, and 4) the Russia / Ukraine conflict, but the one thing that keeps me engaged to look for a much higher US Equity market in the future is that US earnings continue to stand out globally. US stocks are trading at more expensive valuations than their international counterparts, as they have been for quite some time. However, the chart below illustrates the continued earnings superiority of the US equity market, which suggests that US outperformance over the past year has been justified. While international stocks have outperformed the US over the past couple of months as the selloff in domestic tech stocks has accelerated, we would expect US equities to lead the rebound on the other side. 

While earnings estimates for US equities have continued to rise in recent months (even though prices have declined), albeit gradually, expectations for international earnings in both developed and emerging markets have been reduced. Stronger earnings growth potential and less impact from the Russia / Ukraine conflict still support our preference for US equities over Europe, which makes up the majority of the developed international markets benchmark. We are watching for more geopolitical stability and a weaker US Dollar to potentially reinvigorate equities. So, 1) the US over international in equities, 2) bonds still in jeopardy in rising interest rates, 3) commodities still leading, and 4) cash paying nothing but providing shelter in a storm. 

In closing, there was enough new information after Friday's and Monday's market action to warrant some level of expectation that possibly a short-term bottom has been put in. However, I want to stress that these are extraordinary times, and going forward I will hopefully not have to write too many more Special Reports. I also understand there is a risk of becoming "the boy who cried bottoms" if I am not careful with the way I contextualize the information I provide while in this correction. Obviously, if one keeps saying "this could be a bottom" all the way down, eventually he will be proven correct. I, therefore, have tried to objectively present a case for a possible bottom whenever I see enough evidence that one could be forming, but also stress that we need to see strong follow-through and the breaking of resistance levels to help confirm any bottom. Likewise, I have always tried to offer a but...... point that would suggest a bottom is not in and lower lows could ensue.

Please remember, I'm not trying to make bold calls, but rather, like a referee, to call ‘em as I see ‘em. Even if we are, indeed, in a prolonged bear market that will ultimately drop to deeper levels, the countertrend rallies can still be explosive and offer opportunities. If we are not at least anticipating a possible upside reversal, it could be very easy to miss when it does happen. This is why, even though some pain has clearly been endured, staying in this market, particularly when US Equities are still the best port in the storm, remains a prudent backdrop to the investment strategy.

Ken South, May 24, 2022

-----------------------------------------------------------------

Source

https://www.tower68.com/blog/is-the-bear-market-getting-tired

Sunday, May 22, 2022

Astrology (Saturn/Uranus Cycle) 1988 – 2032 as it Pertains to the Markets

Astrology (Saturn/Uranus Cycle) 1988 – 2032 as it Pertains to the Markets

(45 year cycle)

--------------------------------------------------------------
This Saturn/Uranus cycle’s correlation with Finance has had a clear focus – the introduction of Deregulation and the consequences that have flowed from that culminating in the collapse of key banks and many financial institutions and the rescue of others by government and central banks. If this cycle opposition really does correlate with the Credit crunch then it is probable that the issue of how the Finance sector is effectively regulated will not be resolved till after the cycle Three Quarter stage between 2020 and 2023.

The present Saturn/Uranus cycle started recently in February 1988, reaching its outgoing square (+90 degrees) in 1999. The Opposition occurs from 2008 to 2011 and the incoming square (+270 degrees) will be reached in February 2021. (The next cycle will commence in June 2032,) What relationship between intellectual change and the status Quo does this cycle signify ?

What might the cycle mean ?

HOW A NEW MINDSET SWEEPS AWAY ESTABLISHED INSTITUTIONAL STRUCTURES

We have given the generic meaning of this cycle as the ‘Relationship between intellectual change and the Status Quo’. The term ‘Status Quo’ is a short way of saying ‘the established order of things’. ‘Intellectual’ should be taken to refer to reasoning and understanding – to ideas and not to something academic. Whereas the Uranus/Pluto cycle signifies how the structure and methods of intellectual, scientific, technological and aesthetic thought alter in themselves and the Uranus/Neptune cycle signifies how innovative ideas get taken up as ideals by society, the Saturn/Uranus cycle deals with how a new intellectual mindset actually alters or sweeps away established political, economic and institutional and other structures. It is all about ‘ideas in action’ or ’revolutionary ideas’ . We are talking of the emergence of a major new set of societal attitudes or new ideas leading to the break-up of political or socioeconomic structures.

Here we shall be looking at the conjunction for clear indications that new ideas are being born which show signs of changing or sweeping away established political, economic and other institutional structures. Throughout history this conjunction coincides with the overthrow of the establishment, typically governments or ruling parties but as we shall see sometimes even empires.

THE START OF A NEW CYCLE

CONJUNCTION Nov 1986 to Jan 1990, (exact in Feb, June and Oct 1988)

The 1988 Conjunction, allowing for a 10 degree orb, extends from November 30 1986 to  January 3rd 1990. It coincides with one massive change to the established political and economic structure of the world – the collapse of the Soviet Union and the end of the Cold War. It also coincides with other regional events and developments which while not immediately related could be said to have been influenced ultimately by the same new mindset or wave of ideas.

These include the Tiananmen Square massacre in Beijing, China where troops kill 2,000 demonstrators, violent unrest in South Africa leading to a new President F.W. de Klerk lifting a ban on the African National Congress (ANC) and releasing its leader Nelson Mandela, and the exit of Russia from Afghanistan after 8 difficult years. There are also the overthrow of longstanding governments in the Philippines, Haiti, Fiji and Panama.  In all these cases the attempt to overthrow the Status Quo was arguably influenced by the same set of ideas – those pushing a new wave of human rights, democracy and national self determination campaigns. In a sense  the unusual number of peace agreements reached in 1988 between Ethiopia and Somalia, between Chad and Libya, between Egypt and Algeria and between Iran and Iraq could be said to reflect the same drive to allow new ideas to alter the status-quo.

FINANCIAL DEREGULATION – BIG BANG

BIG BANG

The second major correlation is with major shifts or changes to the Status-quo in the structure of institutions at the heart of the world economy. In particular, the 1988 Conjunction comes close to the end October 1986 deregulation of the London Stock Exchange – the so called ‘Big Bang’, which sees the whole established structure of city financial institutions change, and which results in a pay-out of such huge sums of money to partners and traders that the UK property market undergoes a period of wild inflation. A similar deregulatory move culminated in the United States in the same year. Amendments were made to Federal Reserve Regulation Q such that by April 1986 all interest rate ceilings had been eliminated except for the ban on demand deposit interest. The philosophy behind ‘Big Bang’ has much to do with the new economic strategy of ‘globalisation’ that is set to sweep the West. Again here is an idea that alters structures.

ASIAN ‘TIGER’ ECONOMIES

The period also sees the ascendancy of the Asian ‘tiger’ economies – Korea, Malaysia, Thailand, Taiwan and Indonesia, changing the geographical line-up of the established markets. Financial astrologers (such as Langham, Brahy and Jensen cited in Bates & Bowles’s ‘Money and the markets’) have consistently pointed to a correlation between the Saturn/Uranus cycle and economic activity – especially with investment in production. The correlation with the rise and fall of stockmarket prices however has been considered far less marked. Despite this in October 1987, during the period of the Saturn/Uranus conjunction, ‘Black Monday’ occurs – a day on which a massive stock market crash ends a period of marked economic growth and speculation. The effects of this ripple into the following year when the US dollar registers an all time low and when the New York Stock Exchange registers its third largest one day fall ever. Financial collapse on a far greater scale is due to take place precisely at a later stage in this Saturn/Uranus cycle !

DEREGULATION & GLOBALISATION

However it is not part of this book’s plan to examine any complex inter-relation between planetary cycles and stockmarkets or microeconomic conditions. The relationship, if it exists, is far more technical and statistical than this book aims to be or is qualified to cover.  All that can be said is that structural changes in financial institutions as well as changes to the structure of international business play a key part in stockmarket volatility as evident in crashes such as Black Monday. Deregulation of the central money market in London and elsewhere is closely linked to globalisation. As we shall see later deregulation will be inextricably linked to the 2008 global ‘credit crunch’.

 OTHER GEOPOLITICAL CORRELATIONS

There are three other key geopolitical developments between the end of 1986 and the end of 1989  which can be explained as structural changes resulting from a new collective mindset ? The developments are the Tiananmen Square massacre in Beijing, China where troops kill 2,000 demonstrators, violent unrest in South Africa leading to a new President F.W. de Klerk lifting a ban on the African National Congress (ANC) and releasing its leader Nelson Mandela and the exit of Russia from Afghanistan after 8 difficult years.

 CONCLUSION

The key events correlating with this Saturn/Uranus conjunction are therefore the break-up of the Soviet Union and the fall of the Berlin Wall along with the deregulatory changes made to the structure of financial markets that accompany the emergence of globalisation. The suggestion is simple: there is going to be no structural change in society’s major institutions before the year 2032 (when the new cycle starts) that has not in some way got the imprint of these events on it.

-----------------------------------------------------------------------

OUTGOING SQUARE July 1998 to June 2001 (exact in July & Nov 1999 and May 2000)

Can we find in the relevant events and developments of 1999 and early 2000 a clear challenge or extension to the wave of ideas driving the overthrow of governments, institutions and practices inhibiting freedom which were seeded at the 1988 Conjunction ? The exact dates of the outgoing square are July and November 1999 and May 2000, but if we allow an orb of 10 degrees the period stretches from July 1998 to June 2001

DOTCOM CRASH

If the second most important development at the 1988 Conjunction was the Deregulation of financial institutions and the expansion of the number of investors, many of whom directly invested online in shares especially of the new technology companies, then the year 2000 certainly sees a major challenge to these developments – the ‘dotcom’ crash of  April 2000. Though deregulation cannot be said to have led directly to the ‘dotcom’ crash, the ethos it inspired and the practices it encouraged certainly did. It is doubtful whether financial institutions would have piled into the ‘dotcom’ sector to the degree they did without the intensely competitive forces engendered by deregulation. It should be remembered that the 1988 conjunction also coincided with the ‘Black Monday’ stock market crash of October 1987. But the difference between the ‘Black Monday’ crash and the ‘Dotcom’ crash is important. The former was the result of a mixture of market forces, the latter was primarily the result of a combination of structural changes – in regulation, in the communications industry and in the investment community itself. And it is ‘Structural changes’ we are concerned with in this cycle.

ECONOMIC COLLAPSE THROUGHOUT ASIA

At the 1988 cycle conjunction we saw the rise of the Asian ‘tiger economies’ now in the years 1999 and 2000 we see an economic collapse throughout Asia as currency, share and property values plummet. The year had started with Japan reporting the most severe financial downturn in its post-war history. Then in April 1999, at the beginning of the Out square, China’s first major financial bankruptcy occurs as GITIC (Guangdong International Trust & Investment Corp) collapses with debts of US$4.5 billion – over the year China’s economy continues to deteriorate. In August the Ministry of Finance concedes that China is in recession with serious urban unemployment. In July 1999 Daewoo, South Korea’s second largest conglomerate, teeters on the brink of bankruptcy as management announces the corporation cannot meet the interest payments on its debt of a staggering $57 billion. Although in July 2000, as the Out square begins to move out of orb, it is generally concluded that the Asian economies had recovered from the crisis of 1998, the year 2000 sees economic stagnation continue in Japan. However the correlation is with emergent Asian economies and not the leading Far East economy.

 CONCLUSION

The key developments at the Out square are twofold: first the appalling brutality in Chechnya and genocide in Kosovo is a severe challenge to the democratic and human rights optimism that accompanied the collapse of the Soviet Union and the end of the Cold War; second the challenge of the ‘dotcom’ crash to the forces unleashed by deregulation. Will the cycle opposition stage see some kind of maximisation of these developments ?

--------------------------------------------------------------------

OPPOSITION Oct 2007 to Aug 2011 (exact in Nov 2008, Feb & Sept 2009, April & July 2010)

What developments might we expect to see at the Opposition in 2008, 2009 and 2010 when the contemporary movement for democracy and human rights together with the more deregulated investment scene should both reach a point of maximum fruition but where inherent contradictions may surface ?

The Opposition first comes into orb in mid October 2007 and stays in orb, with several short exit periods, through 2008, 2009 and 2010 up till August 2011.

FINANCE – THE CREDIT CRUNCH

TOXIC ‘SUB-PRIME’ LOANS

Only 5 days after the Saturn/Uranus Cycle Opposition first comes into orb on Oct 19 2007 Merrill Lynch reports its first quarterly loss in six years of $8.4 billion  – on structured investment mortgage loans. In the days that follow Switzerland’s largest bank UBS, Japanese megabank Mitsubishi UFJ and Citigroup report similarly drastic losses on US ‘subprime’ loans. This kind of lending means making loans to people who may have difficulty maintaining the repayment schedule. These loans are characterized by higher interest rates, poor quality collateral and less favourable terms – in order to compensate for the higher credit risk. The losses are the first sign that many of such loans on major banks books are toxic – incapable of repayment.

That the message has not reached regulators is reflected by the Europe MiFID deregulatory directive issued on Nov 1 dropping some key rules on trading equities. On Nov 7 and Nov 20 Morgan Stanley and Freddie Mac, America’s largest buyer of home loans both report billion dollar losses from the same cause. On Dec 10 UBS says it will write off a further $10 billion of subprime losses. On Dec 20 Bear Stearns reports its first loss in its 84 year history. As the year ends the US Federal Reserve and the European Central Bank battle to shore up the money markets. In January 2008 Credit Suisse and Countrywide, the US’s largest mortgage lender, are hit by subprime losses while Citigroup and Merrill Lynch report historically unprecedented quarterly losses of $9.8 billion and $16 billion. On Feb 3 the cycle opposition goes temporarily out of orb.

In the seven months the cycle opposition stays out of orb what takes place in the banking markets is simply a consequence of what has already happened – a couple of further loss announcements, the injection by central banks of huge sums, the rescue by JP Morgan of US investment giant Bear Stearns and in Britain the nationalisation of mortgage lender Northern Rock.

BANKING TITAN LEHMAN BROTHERS GOES BANKRUPT

On August 29 the day the cycle opposition comes back into orb Integrity Bancshares becomes the tenth US bank to fail in 2008. But the full force of the returning cycle opposition explodes very shortly after on September 15 when the 158 year old banking titan Lehman Brothers, burdened by $60 billion in soured real-estate holdings, files for bankruptcy. It is the largest corporate failure in the history of the United States ! The markets go into terminal panic while the central banks desperately pump in billions of euros, pounds and in the case of the US Federal Reserve 70 billion dollars and a similar size loan to insurance giant AIG. By September 18 central banks around the world have poured in $180 billion to reassure the markets. The Russian government and the Bank of England together inject similar massive sums.While part of Lehman Bros is sold off, the other major US investment banks Morgan Stanley and Goldman Sachs defensively change their banking status.

CENTRAL BANKS INJECT $620 BILLION

On Sept 29 the US Federal Reserve with the help of the European Central Bank (ECB), the Bank of England and the Bank of Japan agree to lend banks a further $620 billion ! On October 1 2008 the US Congress signs off a $700 billion bailout of the financial industry. On Oct 8 six central banks cut interest rates together in an attempt to shore up confidence in the world’s crisis-stricken financial system with the US Federal Reserve reducing its key rate to 1.5%. On that day the International Monetary Fund (IMF) says the world economy is entering a major downturn. At the same time Iceland is obliged to take over the third largest of its banks while it negotiates a E4.5 billion loan from Russia. On Oct 10 as stocks crash to five year lows the Dow Jones index (DJIA) has its most volatile day ever and the London stock market plunges 10%. On Oct 13 as the central banks pump in further massive sums Wall Street rebounds in the biggest stock market rally since the Great Depression ! The EU/ECB alone puts $2.3 trillion on the line to protect its banks.

However on October 22 the DJIA tumbles 514.45 points – its 7th biggest point drop in history, as investors fear these moves will not prevent the global economy going into deep recession. The next day former Federal Reserve Chairman Alan Greenspan calls the current financial crisis a “once-in-a-century credit tsunami”. However on Oct 28 the DJIA rises 889 points, the 2nd biggest gain in its history. In December as the crisis spreads beyond banking the US administration is obliged to approve an emergency bailout of the US auto industry, offering $17.4 billion in rescue loans. The following month the UK Government will announce a similar measure. On January 1 2009 the Bank of America purchases investment giant Merrill Lynch to save it from bankruptcy. In February the US Treasury pushes out the boat further announcing a stimulus package that could amount to as much as $2.5 trillion.

UK’S ROYAL BANK OF SCOTLAND REPORTS £24.1 BILLION LOSS

In Europe a week later the Bank of England cuts interest rates to 1.5% – the lowest level since its founding in 1694 – it will fall a couple of months later to 0.5% and stay there. On Jan 14 2009 shares in Germany’s biggest bank Deutsche Bank slump as it posts massive losses. On Feb 13 the British Lloyds Banking group, already 43% state owned, announces a £10 billion loss at HBOS, a bank it had taken over four months earlier. But on Feb 13 the Royal Bank of Scotland reports a massive £24.1 billion loss – the largest in British corporate history – partly because of its mis-timed takeover of Dutch bank ABN Amro. In early March Eastern Europe’s struggling banks get a $31 billion loan. In April 2009 as the IMF forecasts losses from the credit crunch could reach $4 trillion, the Saturn/Uranus opposition goes briefly out of orb – till July 1st. During this gap there are no significant money market events.

BY 2009 GLOBAL CREDIT CRUNCH HAS COST $10 TRILLION

On 31 July 2009 the IMF states that the global credit crunch has cost governments more than $10 trillion. However in August France,  Germany and Japan emerge from recession and in September some 27 central banks back new measures to strengthen supervision of the global banking industry – confirmed by the G20 summit on the 26th. On 15 October 2009 the DJIA index breaks through the 10,000 mark – the first time in a year. On Nov 13 the Eurozone economy emerges from recession. On Nov 19 the Organisation for Economic Co-operation and Development (OECD) says growth and recovery are expected in 2010 in just about all world regions. On Nov 27, as the Saturn/Uranus opposition goes out of orb again, US shares fall on worries about Dubai’s debt problems – accentuated by the refusal of the Dubai government to guarantee the debt. For bank debt is now no longer the key issue – the key issue is government debt – not least in the Eurozone area.

Read the book to see how the Eurozone crisis correlates closely with the remaining part of the Saturn/Uranus cycle Out square

This Saturn/Uranus cycle’s correlation with Finance has had a clear focus – the introduction of Deregulation and the consequences that have flowed from that culminating in the collapse of key banks and many financial institutions and the rescue of others by government and central banks. If this cycle opposition really does correlate with the Credit crunch then the health of the banking sector is unlikely to improve till the end of 2016 when the cycle reaches the unchallenging 240 degree stage. However it is probable that the issue of how the Finance sector is effectively regulated will not be resolved till the cycle In Square between 2020 and 2023.

The Saturn/Uranus incoming square came into orb on Jan 11 2020 and will last  until 21 November 2023. The exact hits are in February, June and December 2021. Among the issues that have been correlated with this cycle since 1988 that of Financial Regulation and associated Finance market crises now appears top of the list. Between July and November 2020 any imminent eruption of  a market  crisis or regulatory move remains hidden but in November when the end of the global COVID-19 pandemic is in sight the result of the huge cessation of business and employment for so long is likely to ally with the increasing issue of government debt to lead to an upheaval in this area. Major Upheavals in Russia and China and possibly South Africa and Afghanistan may also be anticipated

--------------------------------------------------------------

Source

http://cyclesofhistory.com/