Search This Blog

Friday, November 22, 2024

How to Read & Understand a Cash Flow Statement

How to Read & Understand a Cash Flow Statement

  • 30 Apr 2020

Whether you’re a working professional, business owner, entrepreneur, or investor, knowing how to read and understand a cash flow statement can enable you to extract important data about the financial health of a company.

If you’re an investor, this information can help you better understand whether you should invest in a company. If you’re a business owner or entrepreneur, it can help you understand business performance and adjust key initiatives or strategies. If you’re a manager, it can help you more effectively manage budgets, oversee your team, and develop closer relationships with leadership—ultimately allowing you to play a larger role within your organization.

Not everyone has finance or accounting expertise. For non-finance professionals, understanding the concepts behind a cash flow statement and other financial documents can be challenging.

To facilitate this understanding, here’s everything you need to know about how to read and understand a cash flow statement.

What is a Cash Flow Statement?

The purpose of a cash flow statement is to provide a detailed picture of what happened to a business’s cash during a specified period, known as the accounting period. It demonstrates an organization’s ability to operate in the short and long term, based on how much cash is flowing into and out of the business.

The cash flow statement is typically broken into three sections:

  • Operating activities
  • Investing activities
  • Financing activities

Operating activities detail cash flow that’s generated once the company delivers its regular goods or services, and includes both revenue and expenses. Investing activities include cash flow from purchasing or selling assets—think physical property, such as real estate or vehicles, and non-physical property, like patents—using free cash, not debt. Financing activities detail cash flow from both debt and equity financing.

Based on the cash flow statement, you can see how much cash different types of activities generate, then make business decisions based on your analysis of financial statements.

Ideally, a company’s cash from operating income should routinely exceed its net income, because a positive cash flow speaks to a company’s ability to remain solvent and grow its operations.

It’s important to note that cash flow is different from profit, which is why a cash flow statement is often interpreted together with other financial documents, such as a balance sheet and income statement.

How Cash Flow Is Calculated

Now that you understand what comprises a cash flow statement and why it’s important for financial analysis, here’s a look at two common methods used to calculate and prepare the operating activities section of cash flow statements.

Cash Flow Statement Direct Method

The first method used to calculate the operation section is called the direct method, which is based on the transactional information that impacted cash during the period. To calculate the operation section using the direct method, take all cash collections from operating activities, and subtract all of the cash disbursements from the operating activities.

Cash Flow Statement Indirect Method

The second way to prepare the operating section of the statement of cash flows is called the indirect method. This method depends on the accrual accounting method in which the accountant records revenues and expenses at times other than when cash was paid or received—meaning that these accrual entries and adjustments cause the cash flow from operating activities to differ from net income.

Instead of organizing transactional data like the direct method, the accountant starts with the net income number found from the income statement and makes adjustments to undo the impact of the accruals that were made during the period.

Essentially, the accountant will convert net income to actual cash flow by de-accruing it through a process of identifying any non-cash expenses for the period from the income statement. The most common and consistent of these are depreciation, the reduction in the value of an asset over time, and amortization, the spreading of payments over multiple periods.

Related: Financial Terminology: 20 Financial Terms to Know

How to Interpret a Cash Flow Statement

Whenever you review any financial statement, you should consider it from a business perspective. Financial documents are designed to provide insight into the financial health and status of an organization.

For example, cash flow statements can reveal what phase a business is in: whether it’s a rapidly growing startup or a mature and profitable company. It can also reveal whether a company is going through transition or in a state of decline.

Using this information, an investor might decide that a company with uneven cash flow is too risky to invest in; or they might decide that a company with positive cash flow is primed for growth. Similarly, a department head might look at a cash flow statement to understand how their particular department is contributing to the health and wellbeing of the company and use that insight to adjust their department’s activities. Cash flow might also impact internal decisions, such as budgeting, or the decision to hire (or fire) employees.

Cash flow is typically depicted as being positive (the business is taking in more cash than it’s expending) or negative (the business is spending more cash than it’s receiving).

Related: How Learning About Finance Can Jumpstart Your Career No Matter Your Industry

Positive Cash Flow

Positive cash flow indicates that a company has more money flowing into the business than out of it over a specified period. This is an ideal situation to be in because having an excess of cash allows the company to reinvest in itself and its shareholders, settle debt payments, and find new ways to grow the business.

Positive cash flow does not necessarily translate to profit, however. Your business can be profitable without being cash flow-positive, and you can have positive cash flow without actually making a profit.

Negative Cash Flow

Having negative cash flow means your cash outflow is higher than your cash inflow during a period, but it doesn’t necessarily mean profit is lost. Instead, negative cash flow may be caused by expenditure and income mismatch, which should be addressed as soon as possible.

Negative cash flow may also be caused by a company’s decision to expand the business and invest in future growth, so it’s important to analyze changes in cash flow from one period to another, which can indicate how a company is performing overall.

Cash Flow Statement Example

Here's an example of a cash flow statement generated by a fictional company, which shows the kind of information typically included and how it's organized.

Statement of Cash Flows

Go to the alternative version.

This cash flow statement shows Company A started the year with approximately $10.75 billion in cash and equivalents.

Cash flow is broken out into cash flow from operating activities, investing activities, and financing activities. The business brought in $53.66 billion through its regular operating activities. Meanwhile, it spent approximately $33.77 billion in investment activities, and a further $16.3 billion in financing activities, for a total cash outflow of $50.1 billion.

The result is the business ended the year with a positive cash flow of $3.5 billion, and total cash of $14.26 billion.

Which HBS Online Finance and Accounting Course is Right for You? | Download Your Free Flowchart

The Importance of Cash Flow

Cash flow statements are one of the most critical financial documents that an organization prepares, offering valuable insight into the health of the business. By learning how to read a cash flow statement and other financial documents, you can acquire the financial accounting skills needed to make smarter business and investment decisions, regardless of your position.

Are you interested in gaining a toolkit for making smart financial decisions and the confidence to clearly communicate those decisions to key internal and external stakeholders? Explore our online finance and accounting courses and download our free course flowchart to determine which best aligns with your goals.

Data Tables

Company A - Statement of Cash Flows (Alternative Version)

Year Ended September 28, 2019 (In millions)

Cash and cash equivalents, beginning of the year: $10,746

OPERATING ACTIVITIES

ActivityAmount
Net Income37,037
Adjustments to Reconcile Net Income to Cash Generated by Operating Activities:
Depreciation and Amortization6,757
Deferred Income Tax Expense1,141
Other2,253
Changes in Operating Assets and Liabilities:
Accounts Receivable, Net(2,172)
Inventories(973)
Vendor Non-Trade Receivables223
Other Current and Non-Current Assets1,080
Accounts Payable2,340
Deferred Revenue1,459
Other Current and Non-Current Liabilities4,521
Cash Generated by Operating Activities53,666

INVESTING ACTIVITIES

ActivityAmount
Purchases of Marketable Securities(148,489)
Proceeds from Maturities of Marketable Securities20,317
Proceeds from Sales of Marketable Securities104,130
Payments Made in Connection with Business Acquisitions, Net of Cash Acquired(496)
Payments for Acquisition of Intangible Assets(911)
Other(160)
Cash Used in Investing Activities(33,774)

FINANCING ACTIVITIES

ActivityAmount
Dividends and Dividend Equivalent Rights Paid(10,564)
Repurchase of Common Stock(22,860)
Proceeds from Issuance of Long-Term Debt, Net16,896
Other149
Cash Used in Financing Activities(16,379)

Increase / Decrease in Cash and Cash Equivalents: 3,513

Cash and Cash Equivalents, End of Year: $14,259


Tim Stobierski is a marketing specialist and contributing writer for Harvard Business School Online.
-------------------------------
Source

https://online.hbs.edu/blog/post/how-to-read-a-cash-flow-statement

Thursday, November 21, 2024

Balance Sheet: Definition, Format & Example

Balance Sheet: Definition, Format & Example

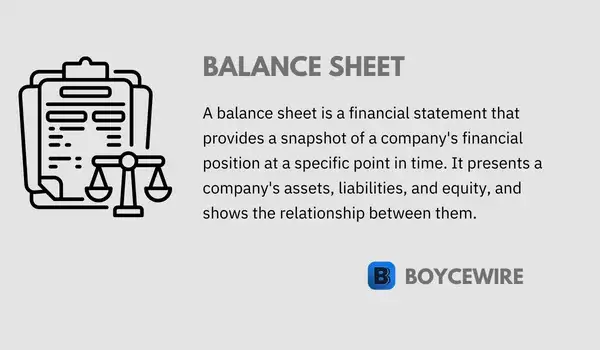
balance sheet definition

What is a Balance Sheet

The balance sheet is a key financial statement that public and private companies report on. It highlights a firm’s assets, liabilities, and equity. This is usually split into two sides or sections, with assets on one side and liabilities and equity on the other.

The key formula to know for the balance sheet is: Assets = Liabilities + Equity. This represents a firm’s financial health and stability. For example, a firm that has more liabilities than assets will have a ‘negative liability’. This means that if it sold everything it owns, it still wouldn’t be able to pay off its debt. In financial terms, this leads to negative shareholder equity.

Key Points
  1. The key formula for the balance sheet is known as the accounting equation: Assets = Liabilities + Shareholder Equity.
  2. The balance sheet gives investors a breakdown into what the company owns (Assets) and what it owes (Liabilities & Shareholder Equity).
  3. The balance sheet provides an insight into the companies financial stability.

Balance Sheet Format

The balance sheet is broken down into two main sections: assets and liabilities. It’s important to note that shareholder equity comes under the ‘liability’ section. The reason for such is that it represents the amount the business owes to its shareholders.

These two sections are further split down by ‘current’ and ‘non-current’. Current simply means short-term, usually within a year. So for example, a current asset is something that is easily convertible to cash within a year. This might be marketable securities, accounts receivable, or inventory and supplies.

By contrast, ‘non-current’ simply means anything that is not convertible within a year. For example, a non-current asset might include factories or real estate, or patents that have a long life span.

As we can see from the example below, the format of the balance sheet is split into two main distinct sections:

Assets

Assets are the first item seen on the balance sheet. It refers to a resource which the company owns, such as cash, bonds, factories, or machinery. This is separated into what is known as ‘current’ assets and ‘non-current’ assets.

Ezoic

Current assets are those that the company can exchange for cash within a short period of time. These are essentially ‘liquid’ assets and provide a good insight into how a company would fare under debt stress. If it requires money to pay off debts, it could sell short-term assets. However, if most of its assets are long-term, then it might find it difficult to cover short-term costs.

Current Assets

  • Cash and cash equivalents includes cash in bank accounts, treasury bills, commercial paper, commercial paper, Treasury bills, and short-term government bonds that have a maturity of less than 3 months.
  • Marketable securities ‘Current’ marketable securities are those which the business can easily sell on public markets. These are highly liquid and include stocks, bonds, preferred shares, and ETFs.
  • Accounts receivable this is money that customers owe the business. It is a legally enforceable claim that businesses have that entitles it payment for services or goods rendered.
  • Inventories these include goods that the firm has available to sell. Examples include raw materials, in-production goods, and final goods. These are generally booked at a lower price than market value.
  • Other current assets this includes other assets that the company owns or advances it has paid. Examples include advance payments to suppliers or employees, or insurance policies. Also includes other assets that can be sold for cash within a year.

Non-current Assets

  • Marketable Securities: ‘Non-current’ marketable securities are investments that the business makes for the long-term. These include stocks, bonds, preferred shares, and ETFs. The difference versus its current counterpart is that the business intends and is able to keep these over an extended period.
  • Property, plant and equipment: this includes fixed assets such as machinery, buildings, computing equipment, motor vehicles, and land.
  • Other non-current assets: this includes all other intangible assets that are not physical but have a value. This can cover intellectual property, goodwill, and patents. These aren’t financial instruments and are usually booked based on their acquired price. Those assets which the firm develops are not usually booked as its price may be wildly over or understated.

Liabilities

A liability is a cost that a business must legally pay. This can range from contractual supplier agreements, services or products due to customers, or debt repayments.

With regards to current liabilities, these are repayments or services due within one year. This includes accounts payable, short-term debt, dividends, and income taxes. Let’s look at how these are shown on a balance sheet:

Current Liabilities

  • Accounts payable: this refers to the amount the business owes its suppliers for goods or services received but not yet paid for. Generally, these have short payment terms of around 30 to 90 days from receipt of the suppliers invoice. This can include costs for utilities, rent, insurance, salaries, raw materials, licensing, or transport.
  • Other current liabilities: this section can vary from company to company. There are a wide range of liabilities that a firm covers here, which it condenses down to one row to make easier reading. This is usually because there are many individual items that are too small to report on independently. Examples might include bonuses, other forms of compensation, interest payable, or taxes payable.
  • Deferred Revenue: deferred revenue is the sum of money a company receives in advance. In other words, the company has yet to deliver the goods or services, but has received payment.
  • Commercial Paper: is a type of short-term debt that corporations use to pay for receivables and other short-term costs. It has a maturity date of no more than 270 days and provides businesses with additional cash flow.
  • Term Debt: this refers to long-term debt which has a payment that is due within the next 12 months. For example, a business might have a 5 year loan with yearly repayments. Although it’s a long-term debt, those repayments that are due within 12 months are current liabilities.

Non-current Liabilities

  • Term-debt: this refers to debt that has a payment due beyond the next 12 months. Any payments on this debt within a year will come under a ‘current liability’. This includes any bonds the firm has issued, as well as any interest or principle payment.
  • Pension liabilities: this includes any payments that it will have to pay its employees for their retirement. For those with DB pensions, they will receive a pension from the employer based on their final-salary.
  • Deferred tax liability: this is how much the firm owes but has not yet paid in taxes which are due in over 12 months time.
  • Other non-current liabilities: this includes everything that a company may not report independently. Usually these are small items that are niche and have small costs. Examples include deferred credit, customer deposits, license renewal, employee-benefits, or capital leases.

Shareholder Equity

On a firms balance sheet, shareholder equity refers to the monetary value that is attributable to its shareholders. In other words, how much the shareholders own.

This is calculated by taking away the firms liabilities from its assets. By doing so, we are left with the shareholder equity. For example, if the company was to go bankrupt, it would have to pay off its existing liabilities. It would have to sell its assets and then pay these off. If there are any funds left, these would be attributable to its owners, the shareholders.

On the balance sheet, there are two main elements of shareholder equity: Equity capital, and retained earnings. Retained earnings are the firms net income minus any dividend payments. For example, the company may make $50 million in net income and pays $20 million in dividends. This would then leave $20 million in retained earnings. However, it also includes retained earnings from previous years which are carried over. So if $10 million was made last year and $20 million this year, then the total would equal $30 million.

There is then equity capital. This refers to the amount investors paid into the business in return for common or preferred stocks. However, this represents the upwards and downwards value of their initial investment. Whilst an investor may have paid $10 for a share, this doesn’t necessarily reflect its current value. Yet this is what the equity capital element of the balance sheet does.

It’s important to note that shareholder equity is not equal to market capitalization. Market capitalization reflects the companies value based on its current stock price. However, the shareholder equity represents the value that shareholders would be left with once all liabilities are paid – thereby reflecting the value of their combined investments.

Balance Sheet Example

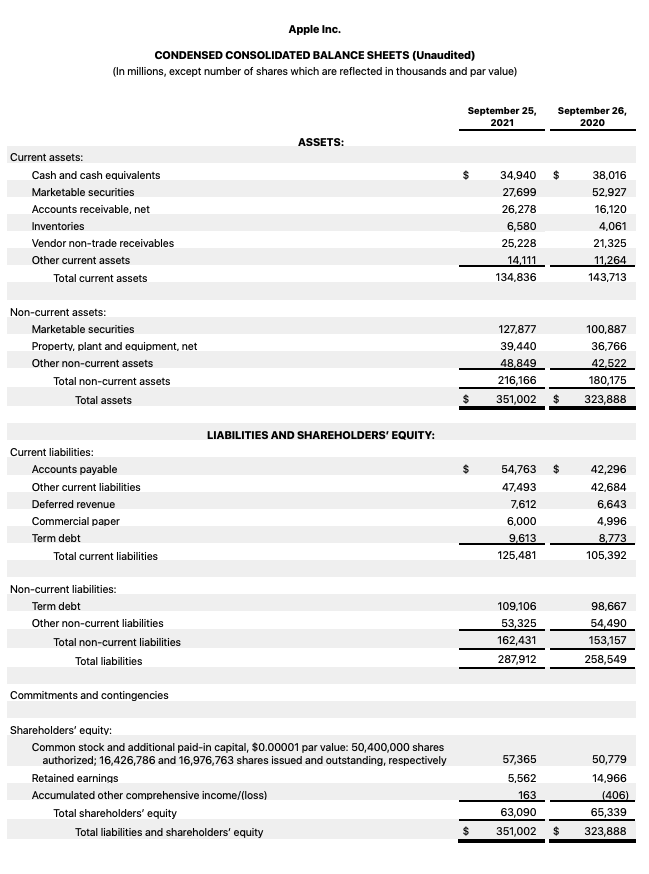
To help further understand the balance sheet, let’s take an example. Below we can see Apple’s consolidated balance sheet for 2021. As we can see, there are the usual sections ‘Assets’ and ‘Liabilities and Shareholder Equity’.

In this statement, Apple provides two columns for comparison in 2021 and 2020. This can help investors compare and contrast performance and see what direction the company is heading in.

balance sheet example of apple

Assets

As we can see from this example, Apple has a row for current assets and non-current assets. These are added together to create the sum of total assets. In this case, it would equal $134,836 + $216,166 = $351,002 for the year ending September 2021.

Liabilities

Again, for liabilities, we take the firm’s non-current and current figures, and add them together. In this case, Apple’s non-current liabilities amount to $162,431 and its current liabilities are $125,481, meaning its total liabilities are $287,912.

Shareholder Equity

We can find shareholder equity by taking the balance sheet formula below. The first is the generic accounting formula. The second formula switches the side of shareholder equity. So shareholder equity = assets – liabilities.

Balance Sheet Formula

balance sheet formula

How to Prepare a Balance Sheet

Most organizations use some form of accounting system or software to prepare their balance sheets. However, by understanding how to prepare a balance sheet, we can identify potential issues that may arise as a result of the system’s miscalculation.

Most organizations use some form of accounting system or software to prepare their balance sheets. However, by understanding how to prepare a balance sheet, we can identify potential issues that may arise as a result of the system’s miscalculation.

1. Set the Reporting Date

A balance sheet is a snapshot of a firm’s financial position at a specific point in time. Most public companies will produce four quarterly reports, as well as an annual one.

The reporting periods can vary depending on the company. Some may report on the calendar year from January – December, whilst others report on the domestic financial year such as April – March.

The final day within the period would be the reporting date. For example, if the period is up until December 31, then this becomes the basis for the statement.

2. Calculate Assets

Once we have the reporting date, we need to identify the value of assets at that date. Depending on the type of company, we may need separate lines for the types of assets we have. Any small amounts of assets such as computer screens may go under the row ‘other assets’.

For small companies, they may want to put the various small level assets into this column. However, for bigger companies that have a number of various high level expenses, it may be better to separate these out. This is so that investors can better understand the structure of the business.

This will be split into the two categories of current and non-current assets. Let’s remind ourselves that current assets are those which are highly liquid and can be converted into currency within 12 months.

Some of the main examples of current assets include:

  • Cash and cash equivalents
  • Marketable securities
  • Accounts receivable
  • Inventory
  • Non-trade receivables
  • Prepaid Expenses
  • Other current assets

Some of the main examples of non-current assets include:

  • Non-current assets
  • Long-term marketable securities
  • Cash surrender value of life insurance
  • Goodwill
  • Intangible assets (e.g. patents)
  • Tangible assets (e.g. property, machinery, and other equipment)
  • Other non-current assets

Once we identify the current and non-current assets, we then add them together to create the value for total assets.

3. Calculate Liabilities

A liability is something that the firm must legally pay for. Again, these are split between current (short-term) liabilities and non-current (long-term) liabilities. Some examples we will need to include on the balance sheet are:

Some of the main examples of current liabilities include:

  • Accounts payable
  • Short-term debt / Commercial paper
  • Accrued expenses
  • Deferred revenue
  • Long-term debt with short-term repayments
  • Other current liabilities

Some of the main examples of non-current liabilities include:

  • Non-current deferred revenue
  • Lease obligations
  • Long-term debt
  • Pension obligations
  • Other non-current liabilities
  • Income taxes

Again, the current and non-current liabilities will need to be added together to create a total value.

4. Calculate Shareholder’s Equity

Large organizations are likely to require a calculation for shareholder’s equity as they will have various owners/stockholders. For small private companies with one or two owners, they won’t need this calculation.

Shareholder’s equity is a combination of items that include:

  • Common stock
  • Preferred stock
  • Treasury stock
  • Paid-in capital
  • Retained earnings

Retained earnings are simply the firms profit once its expenses have been paid alongside any tax and dividends that are due. It’s usually calculate by taking the firms net profit and subtracting dividend payments.

The common, preferred, and treasury stock reflects the value of shareholders investments. This also includes any paid-in capital.

5. Check it Balances

A balance sheet must, well, balance. That means that the accounting equation must run true. Just to remind ourselves, it’s Assets = Liabilities + Shareholder Equity. So to do this, we must add total liabilities to shareholder equity. If it equals total assets, then the balance sheet is correct. However, if it doesn’t then one of the calculations is likely to be amiss.

FAQs

Does a balance sheet always balance?

A balance sheet should always balance. This is because assets should equal liabilities plus shareholder equity. If this doesn’t run true, then the statement is out of balance and highlights an issue with the calculation. This might occur due to a number of reasons such as:
– Incorrect data input
– Exchange rate issue
– Miscalculation of asset value
– Calculation issue with depreciation and amortization
– Double counted on current and non-current sections

What is the purpose of balance sheet?

The purpose of the balance sheet is to show a company’s financial stability at a certain point in time. This is because it shows how much a company owns and how much it owes. If it owes more than it owns, then it has more debt than it can afford to pay. This would be a cause for concern as it represents negative shareholder equity – putting investors cash at risk.

How to Prepare a Balance Sheet

In order to prepare a balance sheet, we must follow the following steps:
1. Set the Reporting Date
2. Calculate Assets
3. Calculate Liabilities
4. Calculate Shareholder’s Equity
5. Check it Balances


About Paul

Paul Boyce is an economics editor with over 10 years experience in the industry. Currently working as a consultant within the financial services sector, Paul is the CEO and chief editor of BoyceWire. He has written publications for FEE, the Mises Institute, and many others.

---------------------------------

Source

https://boycewire.com/balance-sheet-definition/